Does It Mean More?
Quincy Smith · October 1, 2026
Sixty-two and a half. The percentage of the SEC that was ranked in the Associated Press's Top 25 on Sunday afternoon in the 2026 Week 5 poll. A single conference, occupying nearly half of all available spots with more than half the conference represented. Yet, multiple SEC teams lost the week prior, some still don't have impressive wins, and there are other teams with better records than their SEC counterparts but they aren't even considered.
The Case Against the SEC
It seems to be a tale as old as time. "The SEC is a gauntlet," they say. Other conferences don't understand what it's like to play all these ranked teams week in and week out. Yet, the SEC hasn't even played for a national championship in 3 years. How are they continually being ranked so high and do they deserve it? It feels like these rankings are propping up a conference that has failed to deliver over the past few years to justify the massive TV deals that back the SEC. Why aren't we giving those spots to other teams who deserve it? Are the AP Poll writers just downright biased towards this conference?
Additionally, the SEC seems to get a leg up on everyone else. They get a head start by dominating the preseason polls, play FCS schools in their non-conference slate, and then only play each other. It feels like they get to artificially inflate the number of ranked matchups they play, and all of a sudden every loss gets a soft landing because we are talking about the quality of a loss rather than the loss itself. How can we even determine if the SEC holds any water if they start high, only play themselves, and then claim to be the premier conference in college football?
Put it all together and the case against the SEC comes down to six charges: a head start in the preseason, soft landings after losses, voters with a thumb on the scale, a loop of "ranked" teams that are only ranked because they keep playing each other, computer numbers inflated by an insular schedule, and, after all that, no hardware to show for it.
Your grievances are valid. Your feelings are heard. To test each charge, we looked at 21 seasons of college football (2005-2025): every AP poll, four computer ratings (SP+, FPI, SRS and Elo), NFL draft and recruiting data, and every game played between conferences, always comparing SEC teams with otherwise-equal teams from the other power programs.1 Let's dive into what the numbers say and really find out if it just means more.
The Head Start
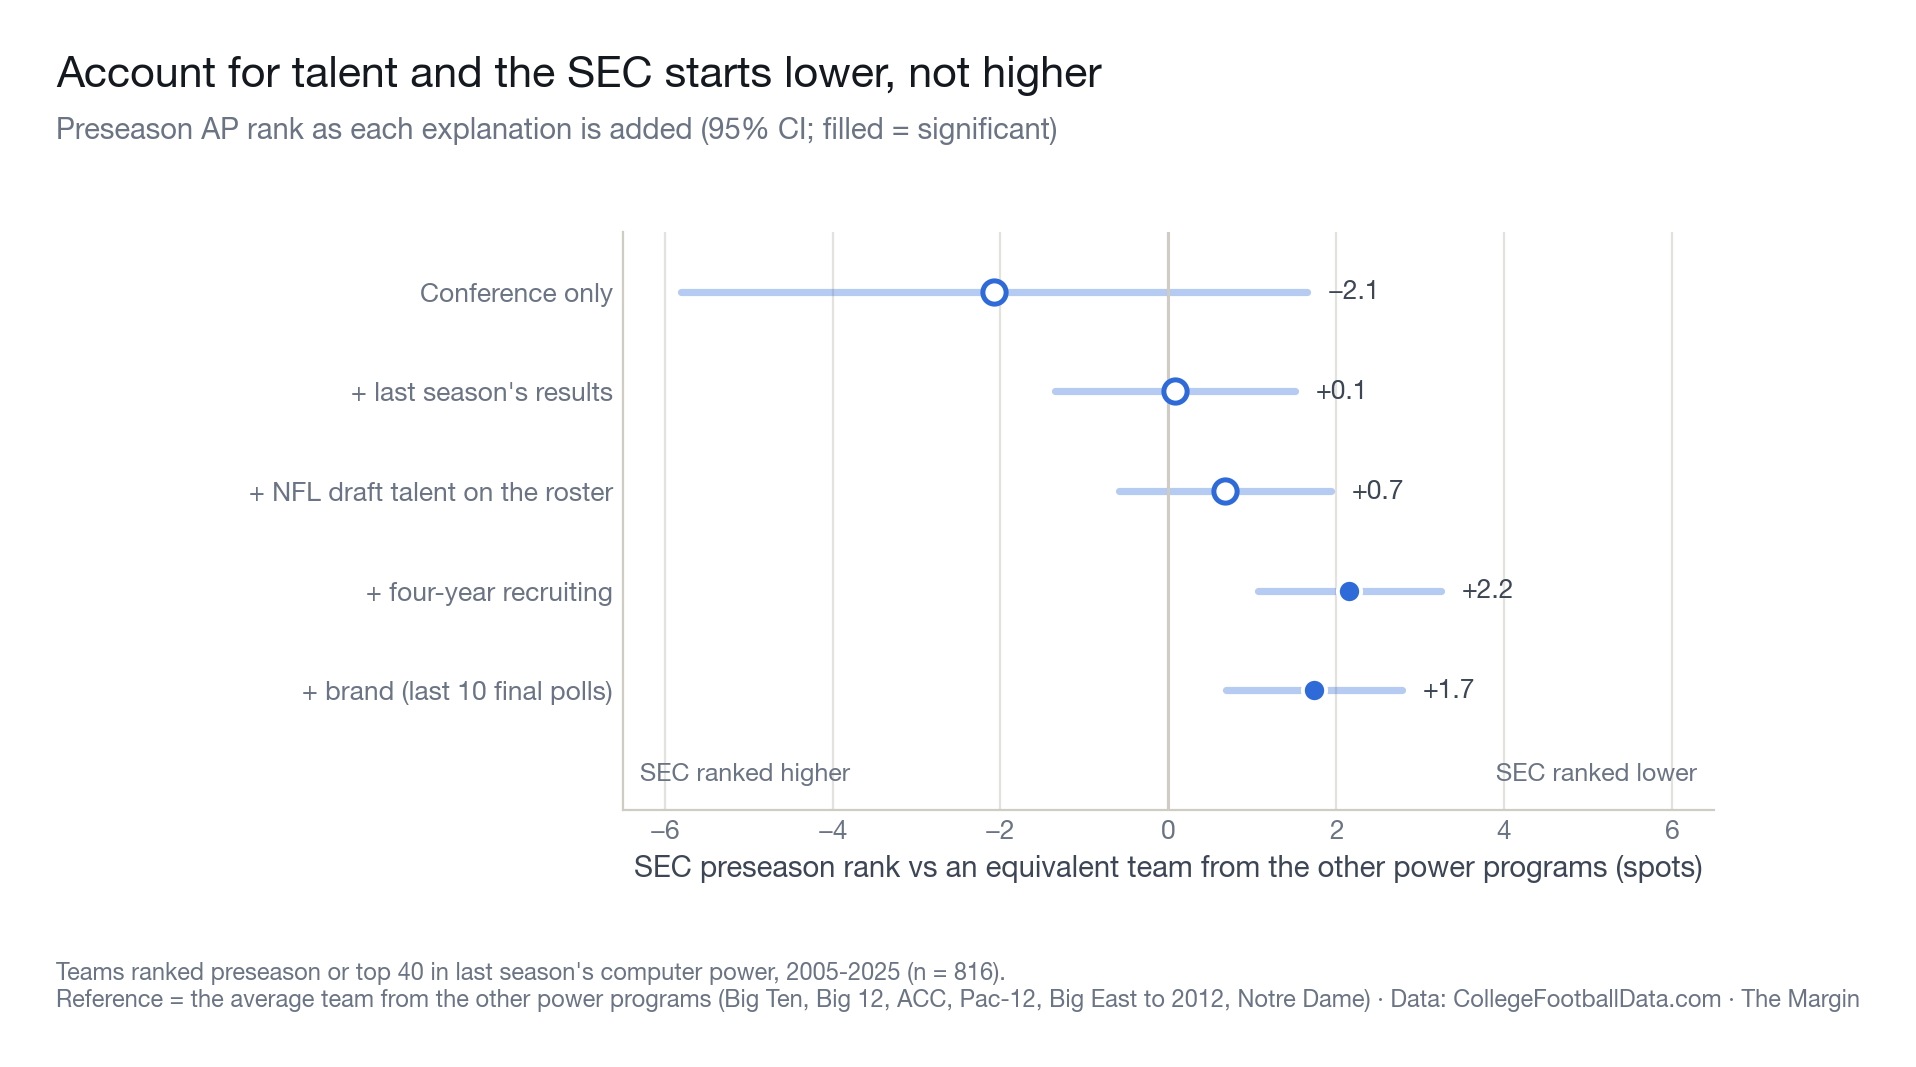
Preseason polls do their best to track last year's results, analyze offseason changes, and project team rankings into the future. In fact, there is a positive correlation with preseason rank and previous season results (0.73), recruiting (0.59), and eventual top 100 NFL draft picks (0.51). And the SEC seems to lead in these categories. Preseason-ranked SEC teams average nearly three eventual top-100 NFL draft picks per roster, and their four-year recruiting runs 1.78 standard deviations above the FBS average. The talent that exists within the conference is unreal and unmatched, which explains why SEC teams start the season so high. Sure enough, account for last season and the roster, and SEC teams actually start 1.7 to 2.2 spots lower than equal teams from the other power programs.2
Still, there is some brand bias involved. Brand name - measured as success over the last 10 years - correlates with preseason ranking at 0.62. But once the games are played, brand tells you nothing: it has no predictive value for where a team actually finishes.3 Yet, this brand bias expands beyond the SEC to all the blue bloods of college football, with the leaders being Ohio State (2.3 preseason spots gained from brand alone), Alabama (2.1), Oklahoma (1.6), LSU (1.0), Georgia (1.0), USC (0.9), Clemson (0.7), Florida (0.6), and Oregon (0.6). These big brands of college football are given a boost for their name in the preseason poll, something that is not an SEC-unique feature.
If anything, the SEC seems to be the most on par with its rankings. When it comes to overrating teams, only 25% of preseason-ranked SEC teams finished the season 10 or more spots below their preseason slot in the computer rankings. Every other power conference saw at least 30% of its teams fall that far, with the ACC bringing up the rear of the power conferences at 43%.
Soft Landings
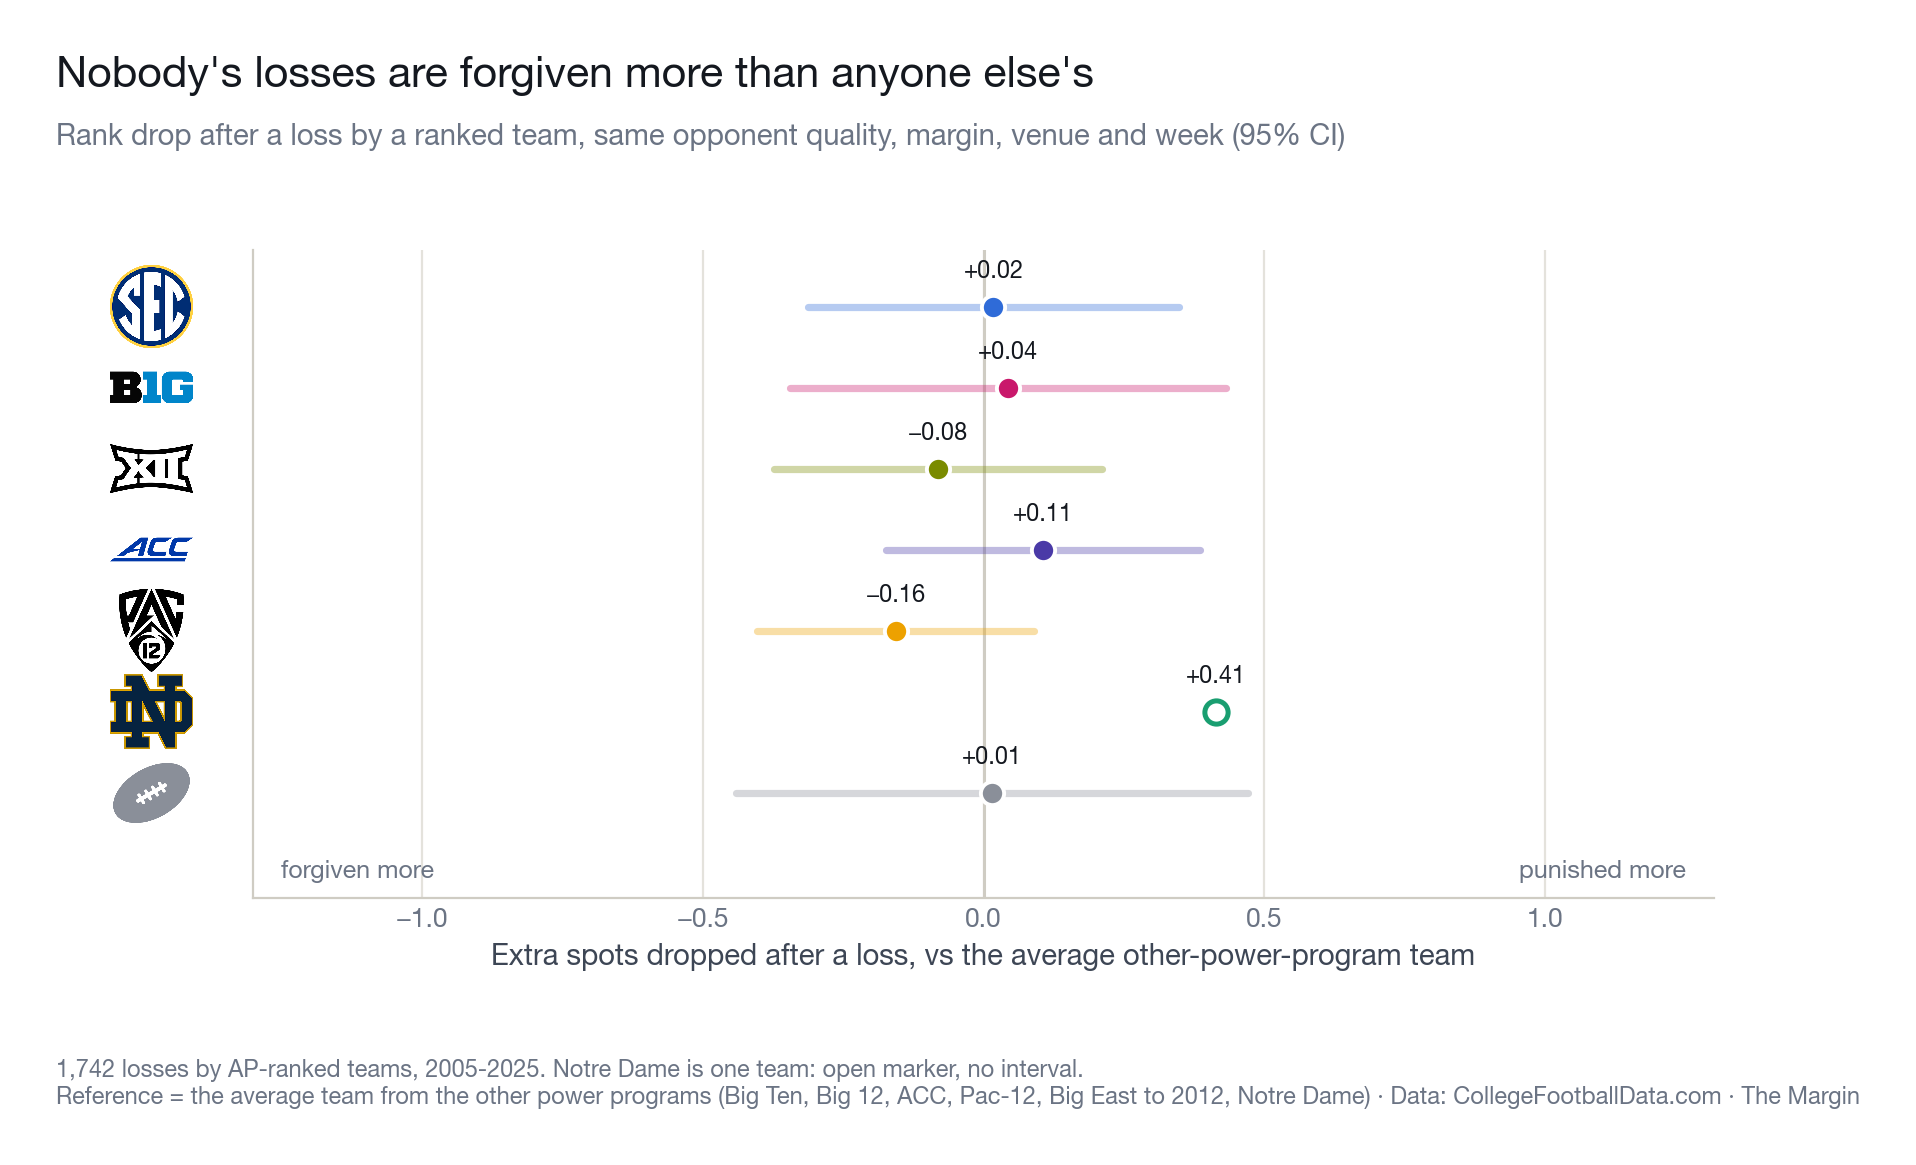
Well, the SEC may deserve some of those early rankings, looking at the recruiting and draft production, but that still leaves the door open for the soft landings they are given by voters. Using 1,742 losses by AP-ranked teams from 2005 to 2025 and holding pre-loss rank, margin, opponent quality, venue, and week constant, we actually see that every major conference sits within ±0.16 extra spots of punishment or favor, with the SEC sitting at +0.02 extra spots in comparison. None of those differences are statistically significant: the Big 12 (−0.08) and the Pac-12 (−0.16) look slightly favored, but it's noise.4 To nobody's surprise, Notre Dame gets the most punishment at +0.41 (nothing to say here but join a conference and get a real schedule), though as a single program that number comes with a grain of salt.5 Further, the SEC sat right in the middle for spots dropped per loss at 5.85, with all other conferences sitting between 5.54 and 6.51. Prior to 2020, voters did grade SEC losses on a slightly different curve: losing to a ranked team cost an SEC team about 1.2 fewer spots than it cost everyone else, while losing to an unranked team cost it a little more, so it netted out to almost nothing.6 Even that has since washed out in the mind of the voter. Nonetheless, nobody's losses are favored over another's on conference name alone.
The Biased Voter
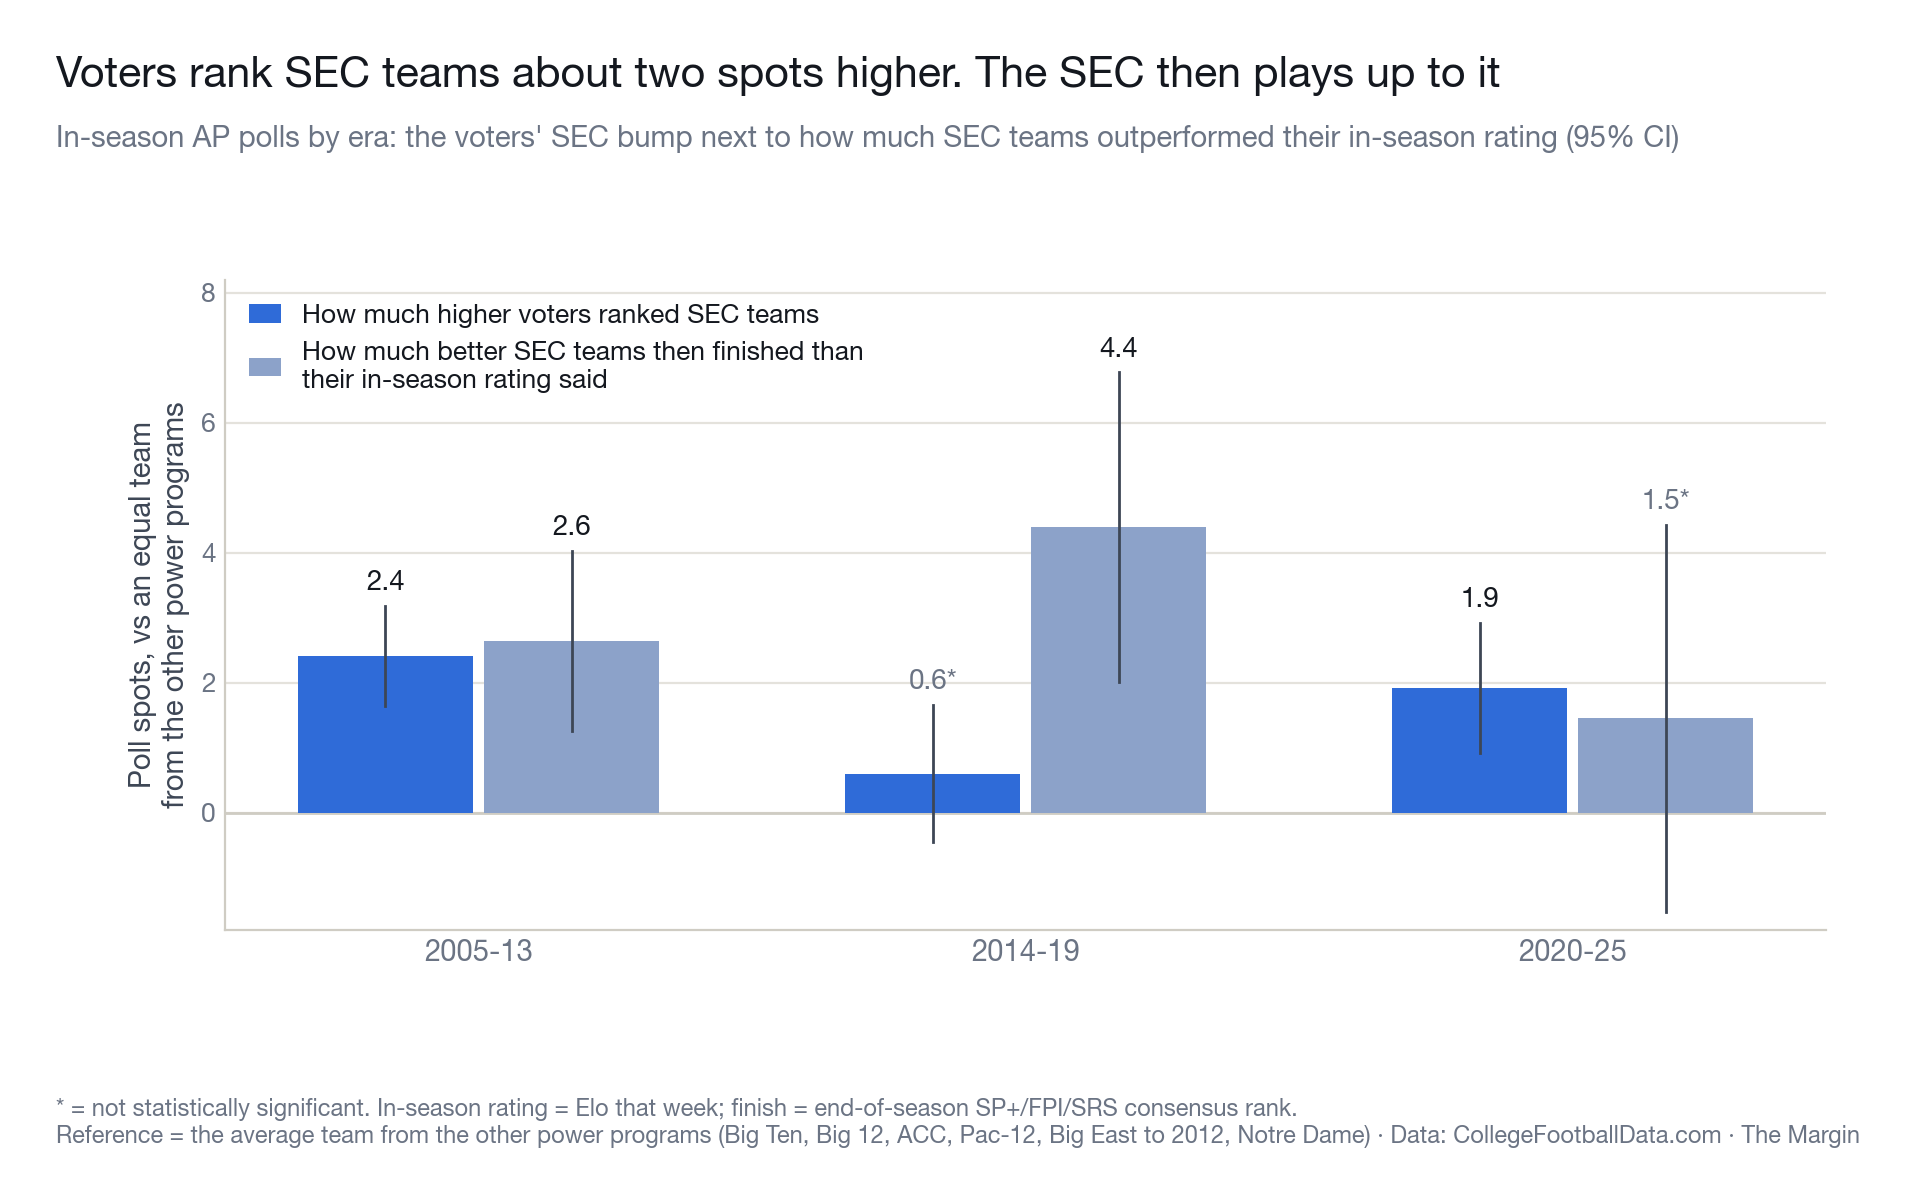
One real bias we can find in the voting system is that SEC teams are ranked about two spots higher than equal counterparts in most eras, a statistically significant finding when comparing teams with the same Elo rating and record.7 Comparatively, the ACC and the Pac-12 received essentially no bump beyond their records (0.5 to 0.8 spots, not statistically significant).8 Yet, when looking at the computer metrics, the SEC makes up that bump and then some (2.7 spots) by the end of the season when compared to a team with a similar in-season computer rating.9 The AP typically ranks about one fewer SEC team than the computers do, and in the final poll there is no SEC premium once strength of schedule is counted (0.04 spots).
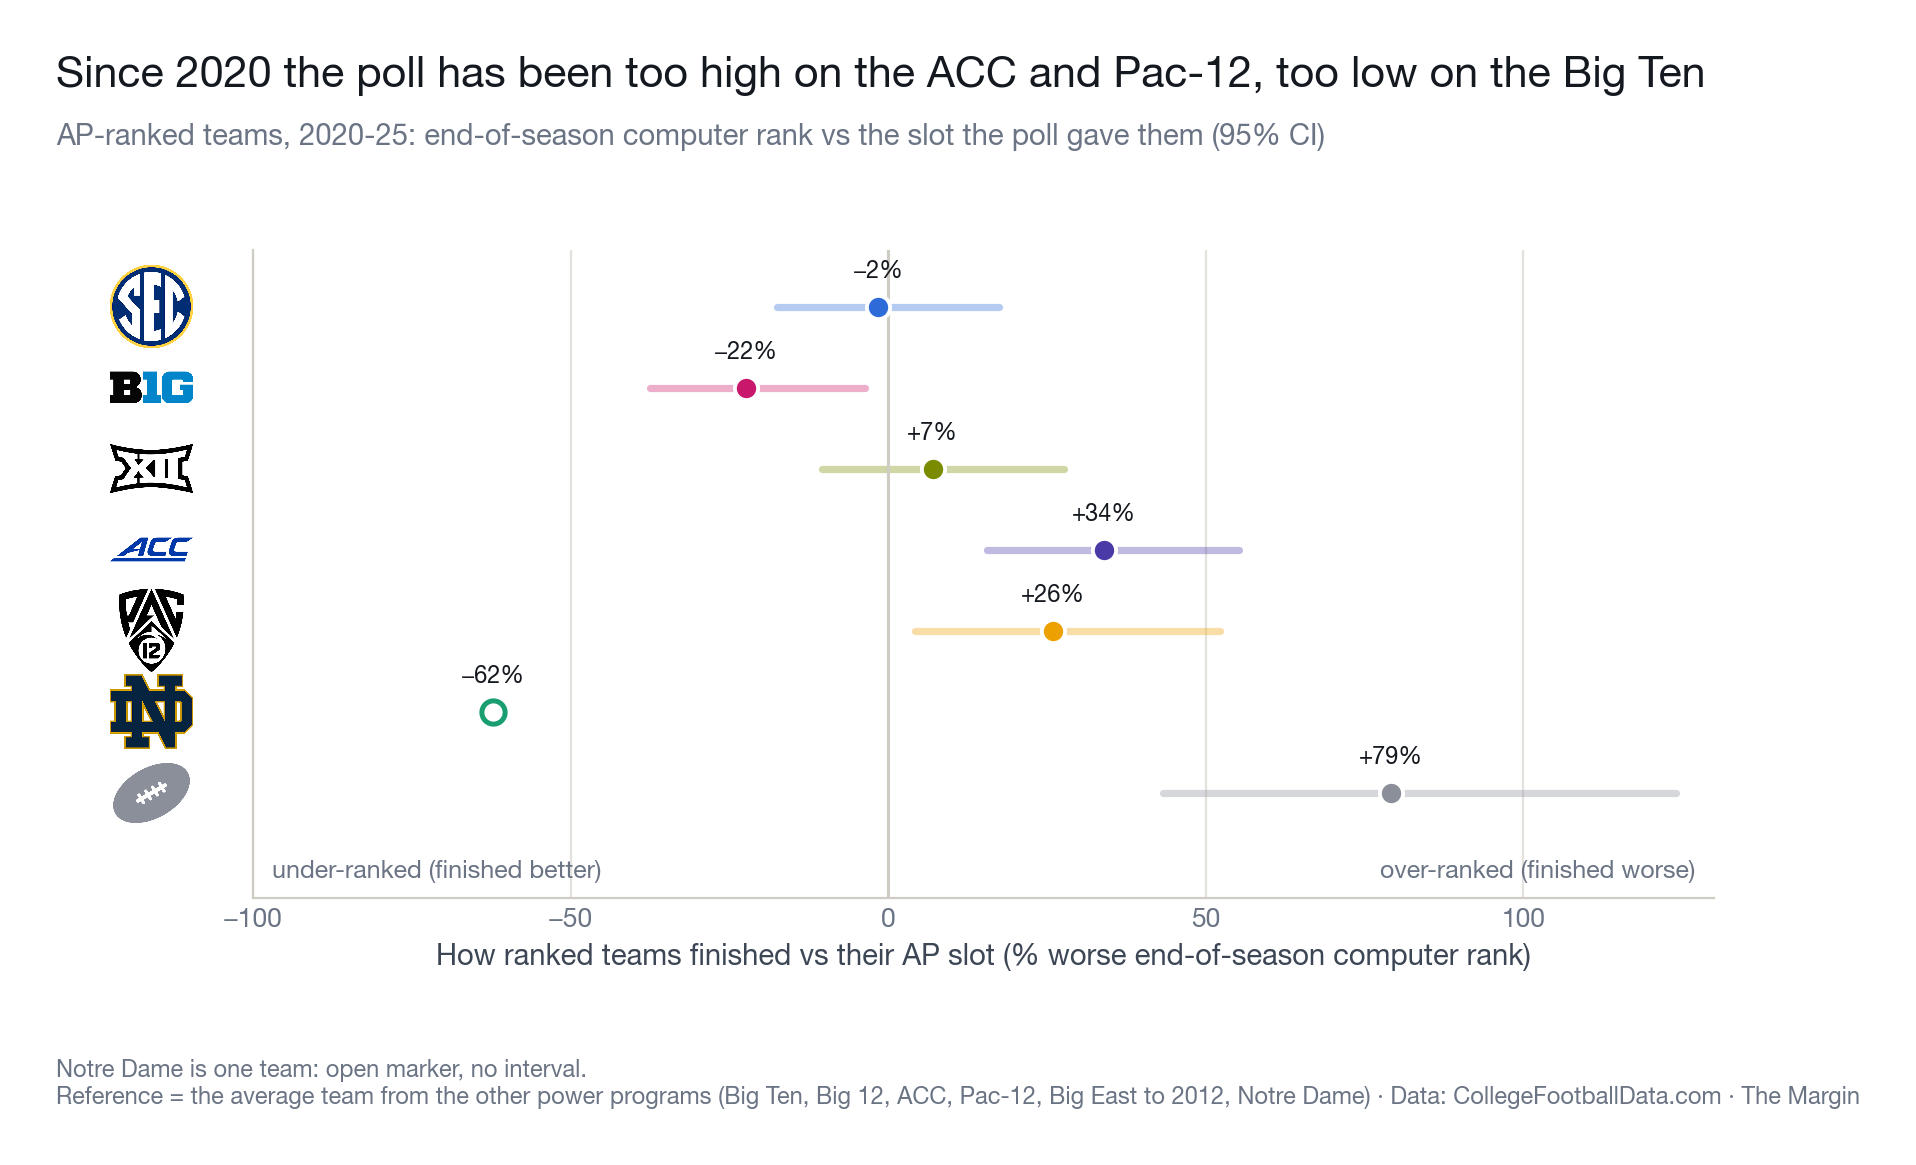
Since 2020, it seems like the AP voters are a little all over the place, which is acceptable as they are only human. The voters had faith in the records of the teams while computers seemed to disagree in varying degrees. Ranked ACC teams finished 34% (3.7 spots) worse than where the poll had them, and ranked Big Ten teams finished 22% (2.3 spots) better. The Pac-12 leaned the same way as the ACC (26% worse), though that result doesn't hold up as firmly.10 Funny enough, the SEC and the Big 12 finished the closest when comparing their in-season AP rankings to where the computers had them at season's end, suggesting the AP Poll is nearly spot on when it comes to the SEC.
Did They Earn It?
So we have seen so far that SEC bias in polling was extremely minimal, just a two-spot bump week to week, but from preseason to postseason rankings, the SEC was aptly ranked. The bigger question is do they even deserve it? How do we know if those teams are good if they only play each other?
Critics are right that voters do grade the name next to the ranking. A loss to a ranked opponent costs about a spot and a half less than a loss to an equally good unranked team, and a win over a ranked team earns about a spot and a half more. Lose to a good team that happens to be unranked and you get no credit at all. Nobody plays more ranked teams than the SEC, so nobody cashes in on that more often.11 The loop is real. The only question is whether those "ranked" opponents deserved the label.
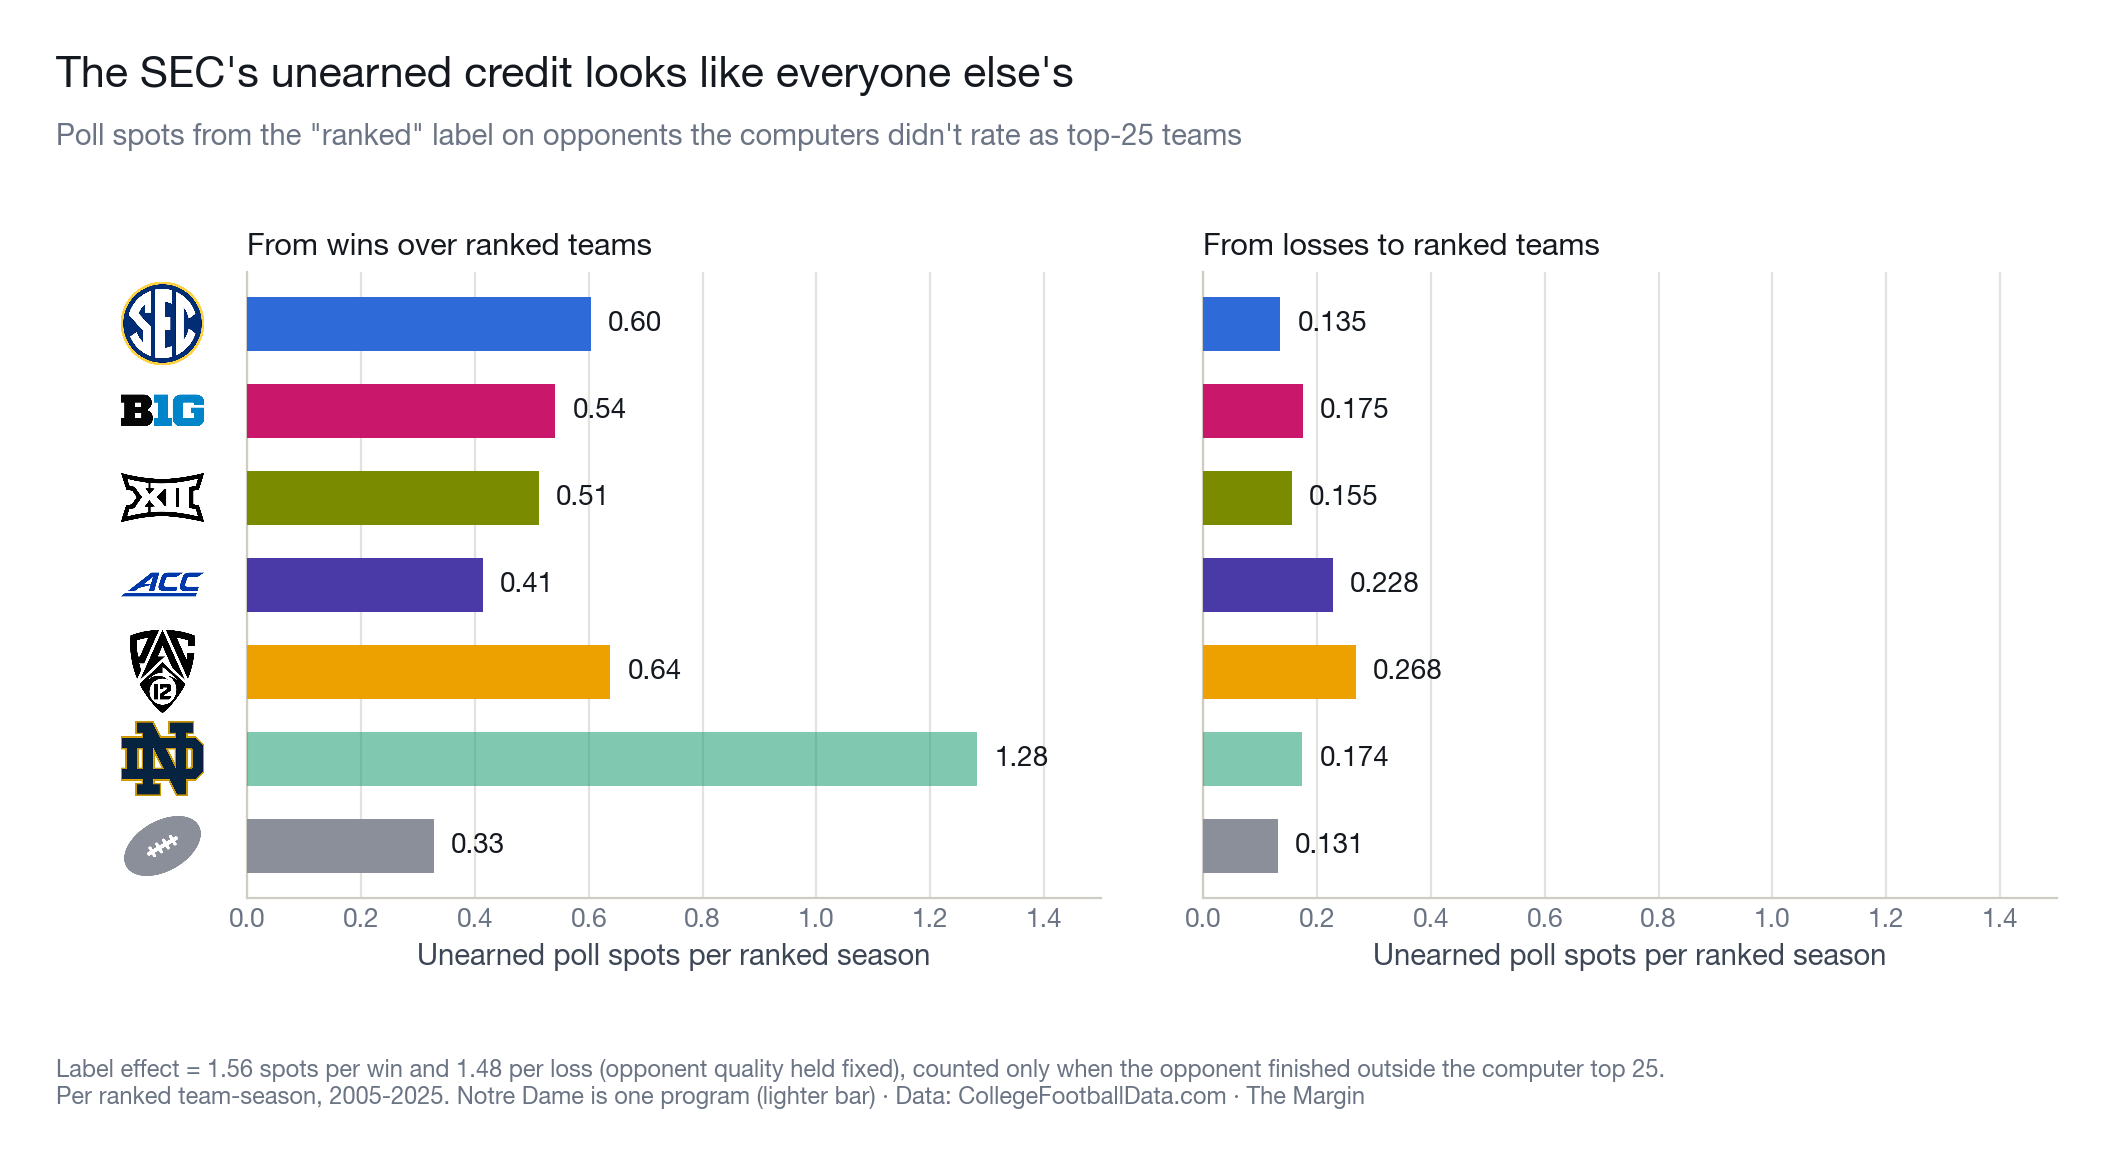
First, we see that the SEC does pick up some unearned credit, meaning poll spots gained from beating or losing to ranked teams the computers didn't rate as top-25 caliber: 0.60 spots per ranked season from wins and 0.135 from losses.12 However, this is in line with other major conferences for wins (range: 0.41–0.64), and the SEC's figure on losses is the lowest of any power conference (others range from 0.155 to 0.268). Among conferences, the Pac-12 is actually the largest beneficiary in both of these cases (wins = 0.64, losses = 0.268).
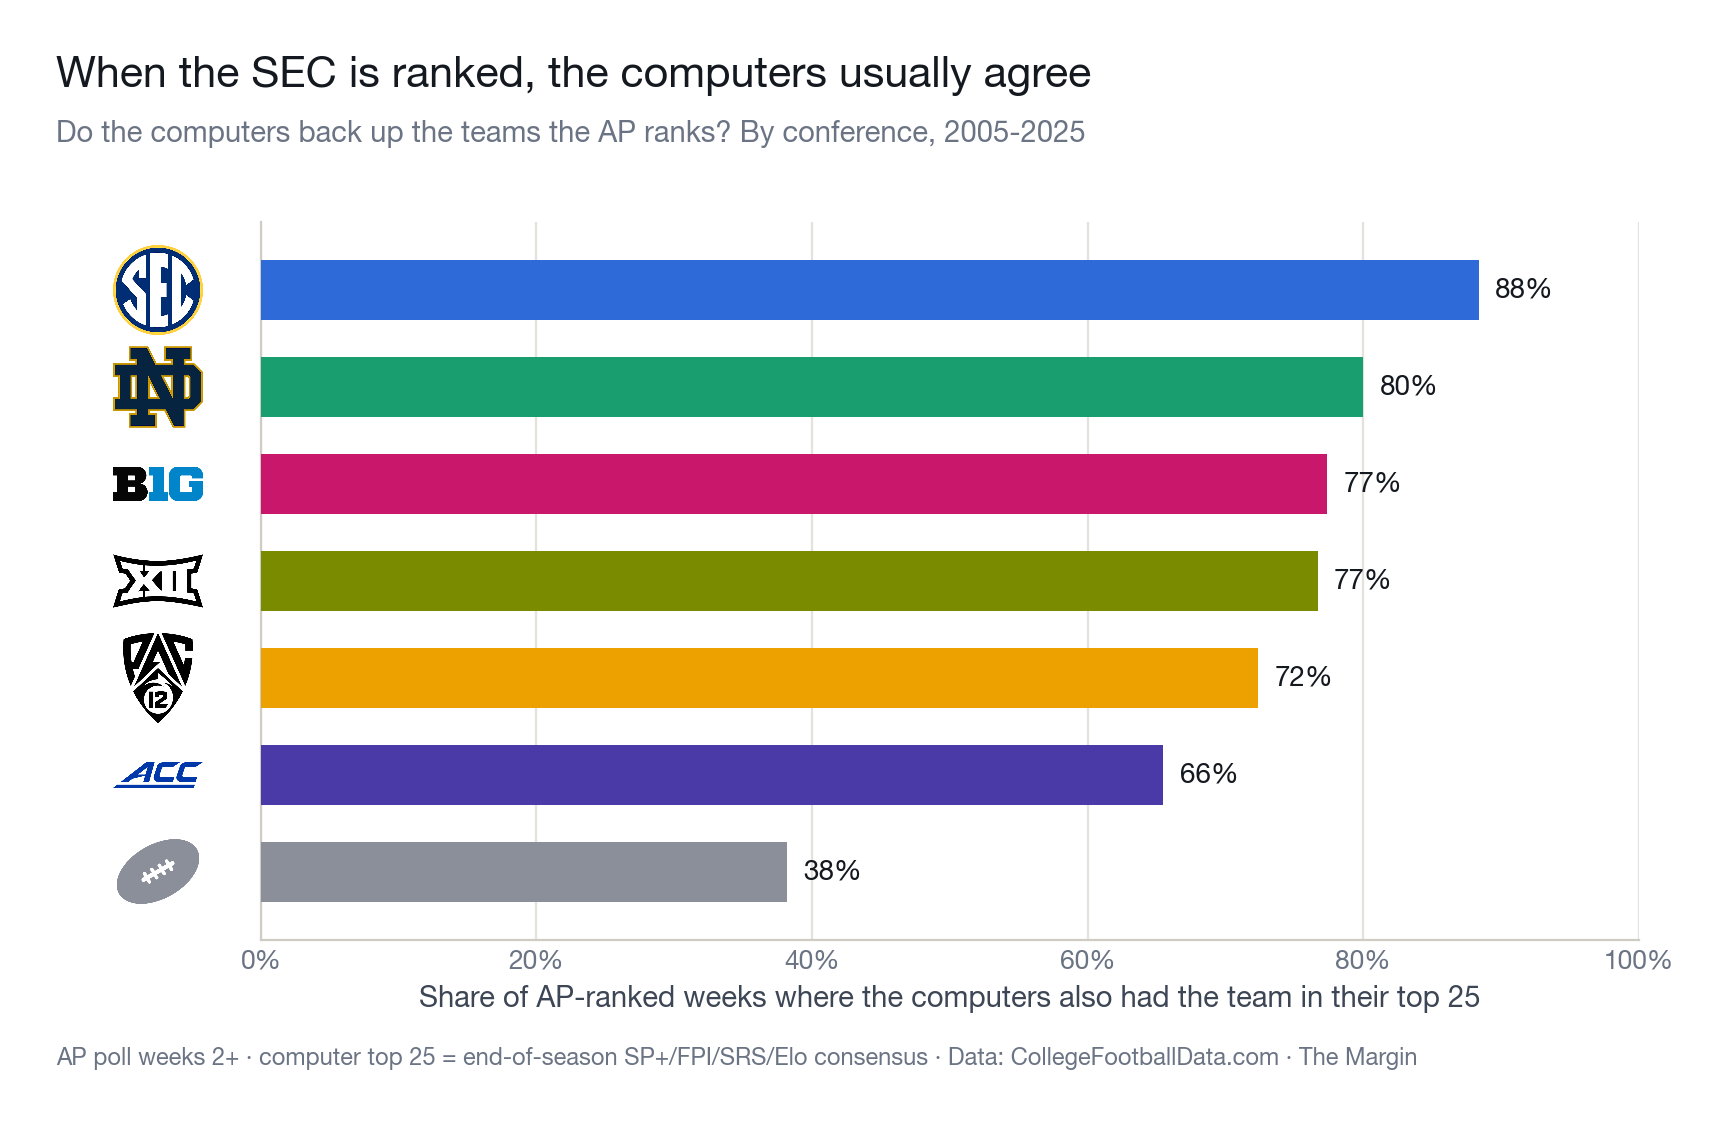
When the AP ranks an SEC team, the computers usually agree it belongs there: in nearly 90% (88%) of the weeks an SEC team was ranked, it went on to finish in the top 25 of the computer metrics. Using the same measure but with that week's Elo to avoid hindsight, the SEC still leads the pack at 84%, followed by the Big Ten (83%), the Big 12 (76%), the Pac-12 (74%), and the ACC (62%).
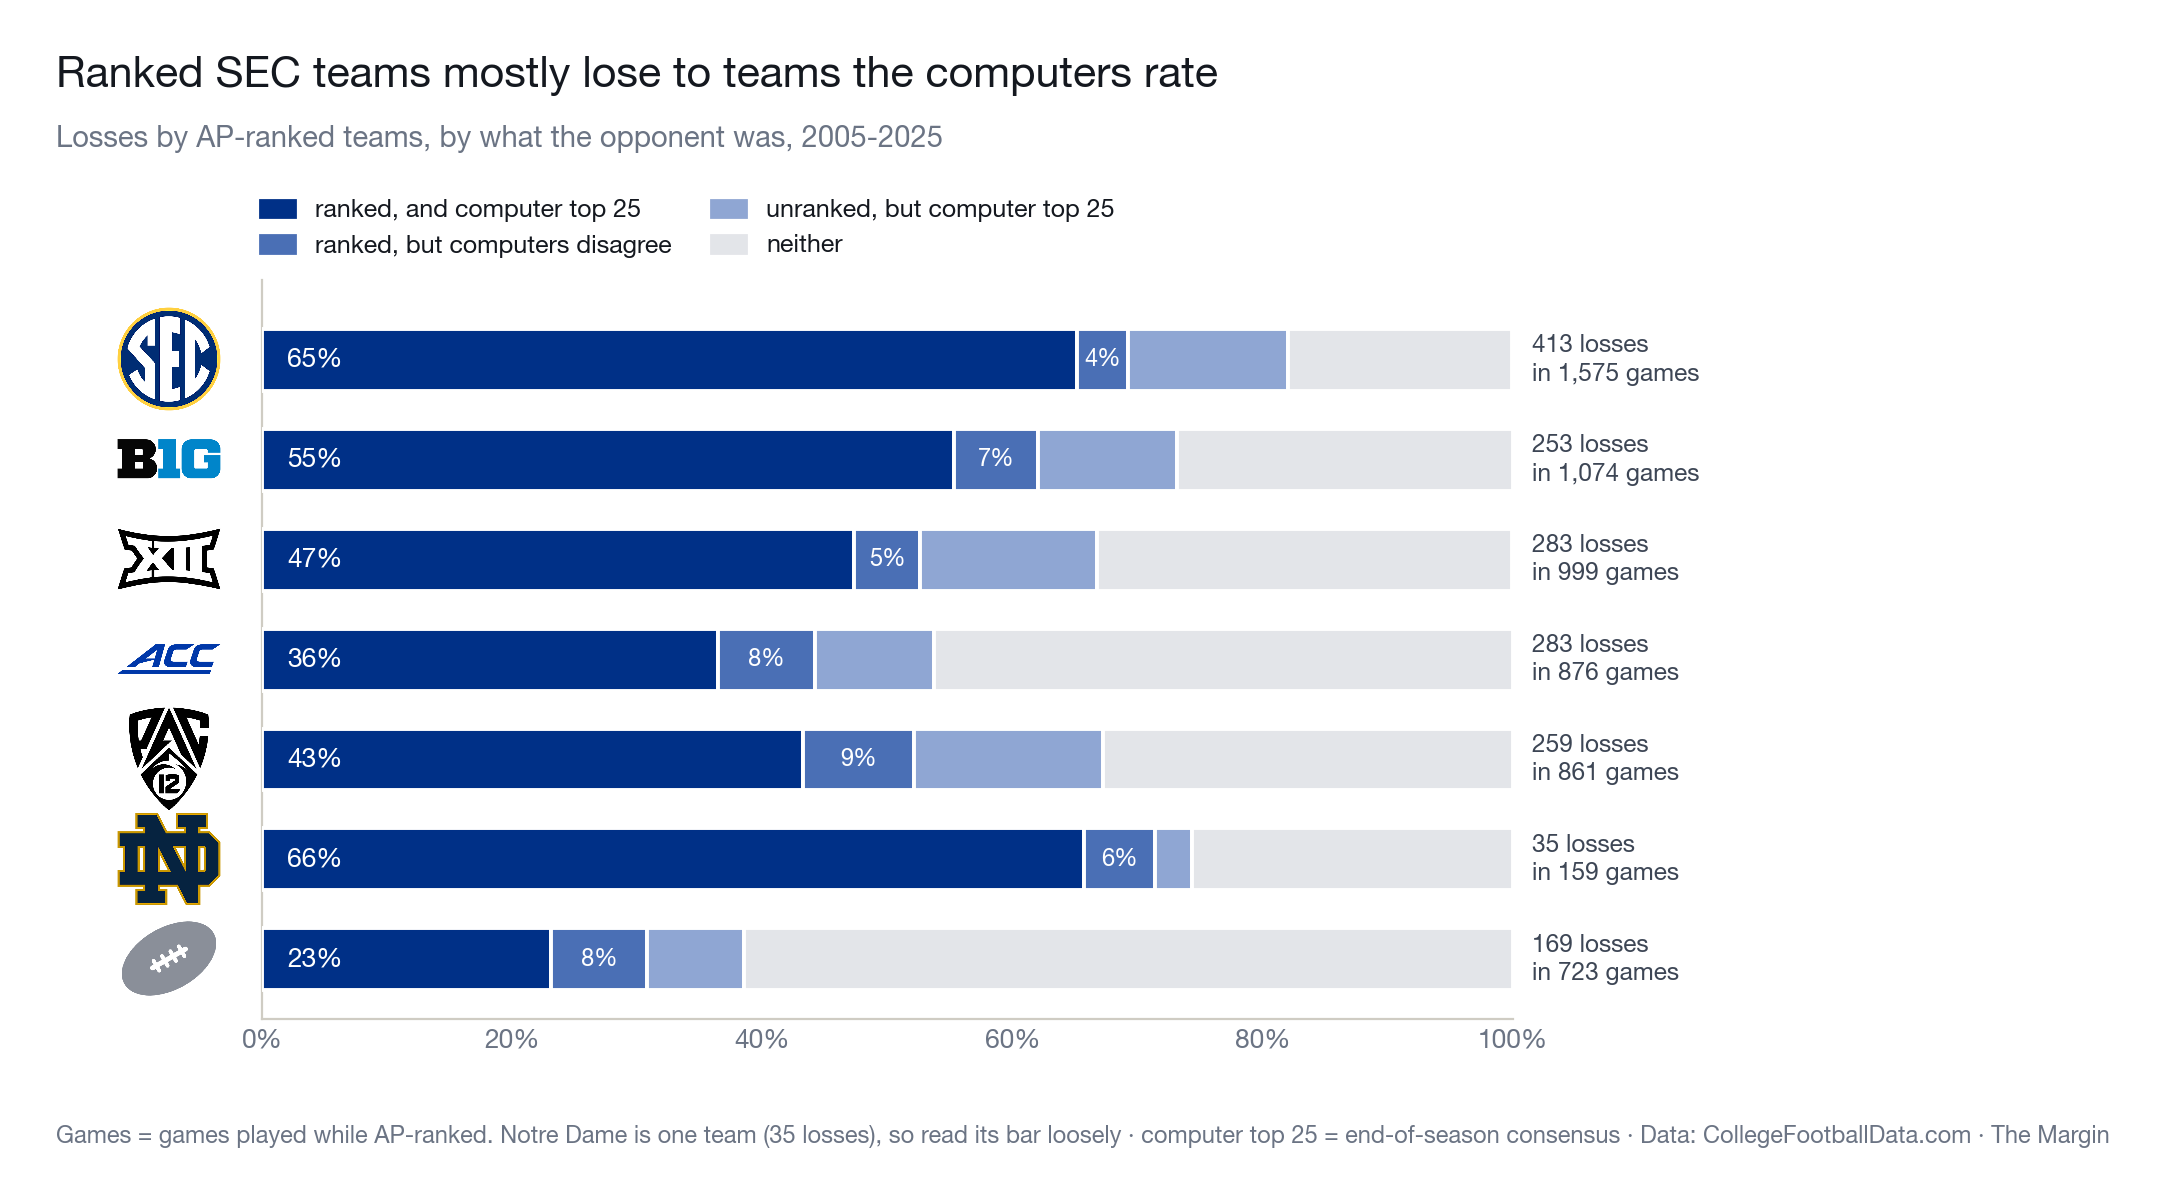
Seeing the true toughness of these teams, this is where the quality losses argument begins to take shape. Roughly three quarters of all ranked SEC team losses came to other teams that finished top 25 in computer metrics (only 17 in 21 seasons came to a team that was ranked in the AP poll and not in the computers). Juxtapose this conference strength to the ACC, where around one in two ranked losses came to non top 25 computer teams, it becomes hard to overlook how often these SEC teams are going out and playing tough competition.
The Gauntlet
Year in and year out, the SEC finds itself holistically near the top. While the top end of the conference isn't always the absolute best, the middle and bottom of the conference pull their own weight better than any other conference. Over the last 20 years, half of the SEC finished in the top 25 by computer averages, while no other conference averaged more than 40%. Last year, the median SP+ for the SEC was 5 points higher than the Big Ten, the next closest conference, despite the top of the Big Ten being ahead of the top of the SEC. So far in 2026, the gap between the SEC and Big Ten has closed, but they are still measuring clearly ahead of the other conferences. Day in and day out, teams in the SEC are playing against guys who will go on to play on Sundays, as the SEC paced the country in first-round picks with about 70% more than the second-place Big Ten (205 to 120).
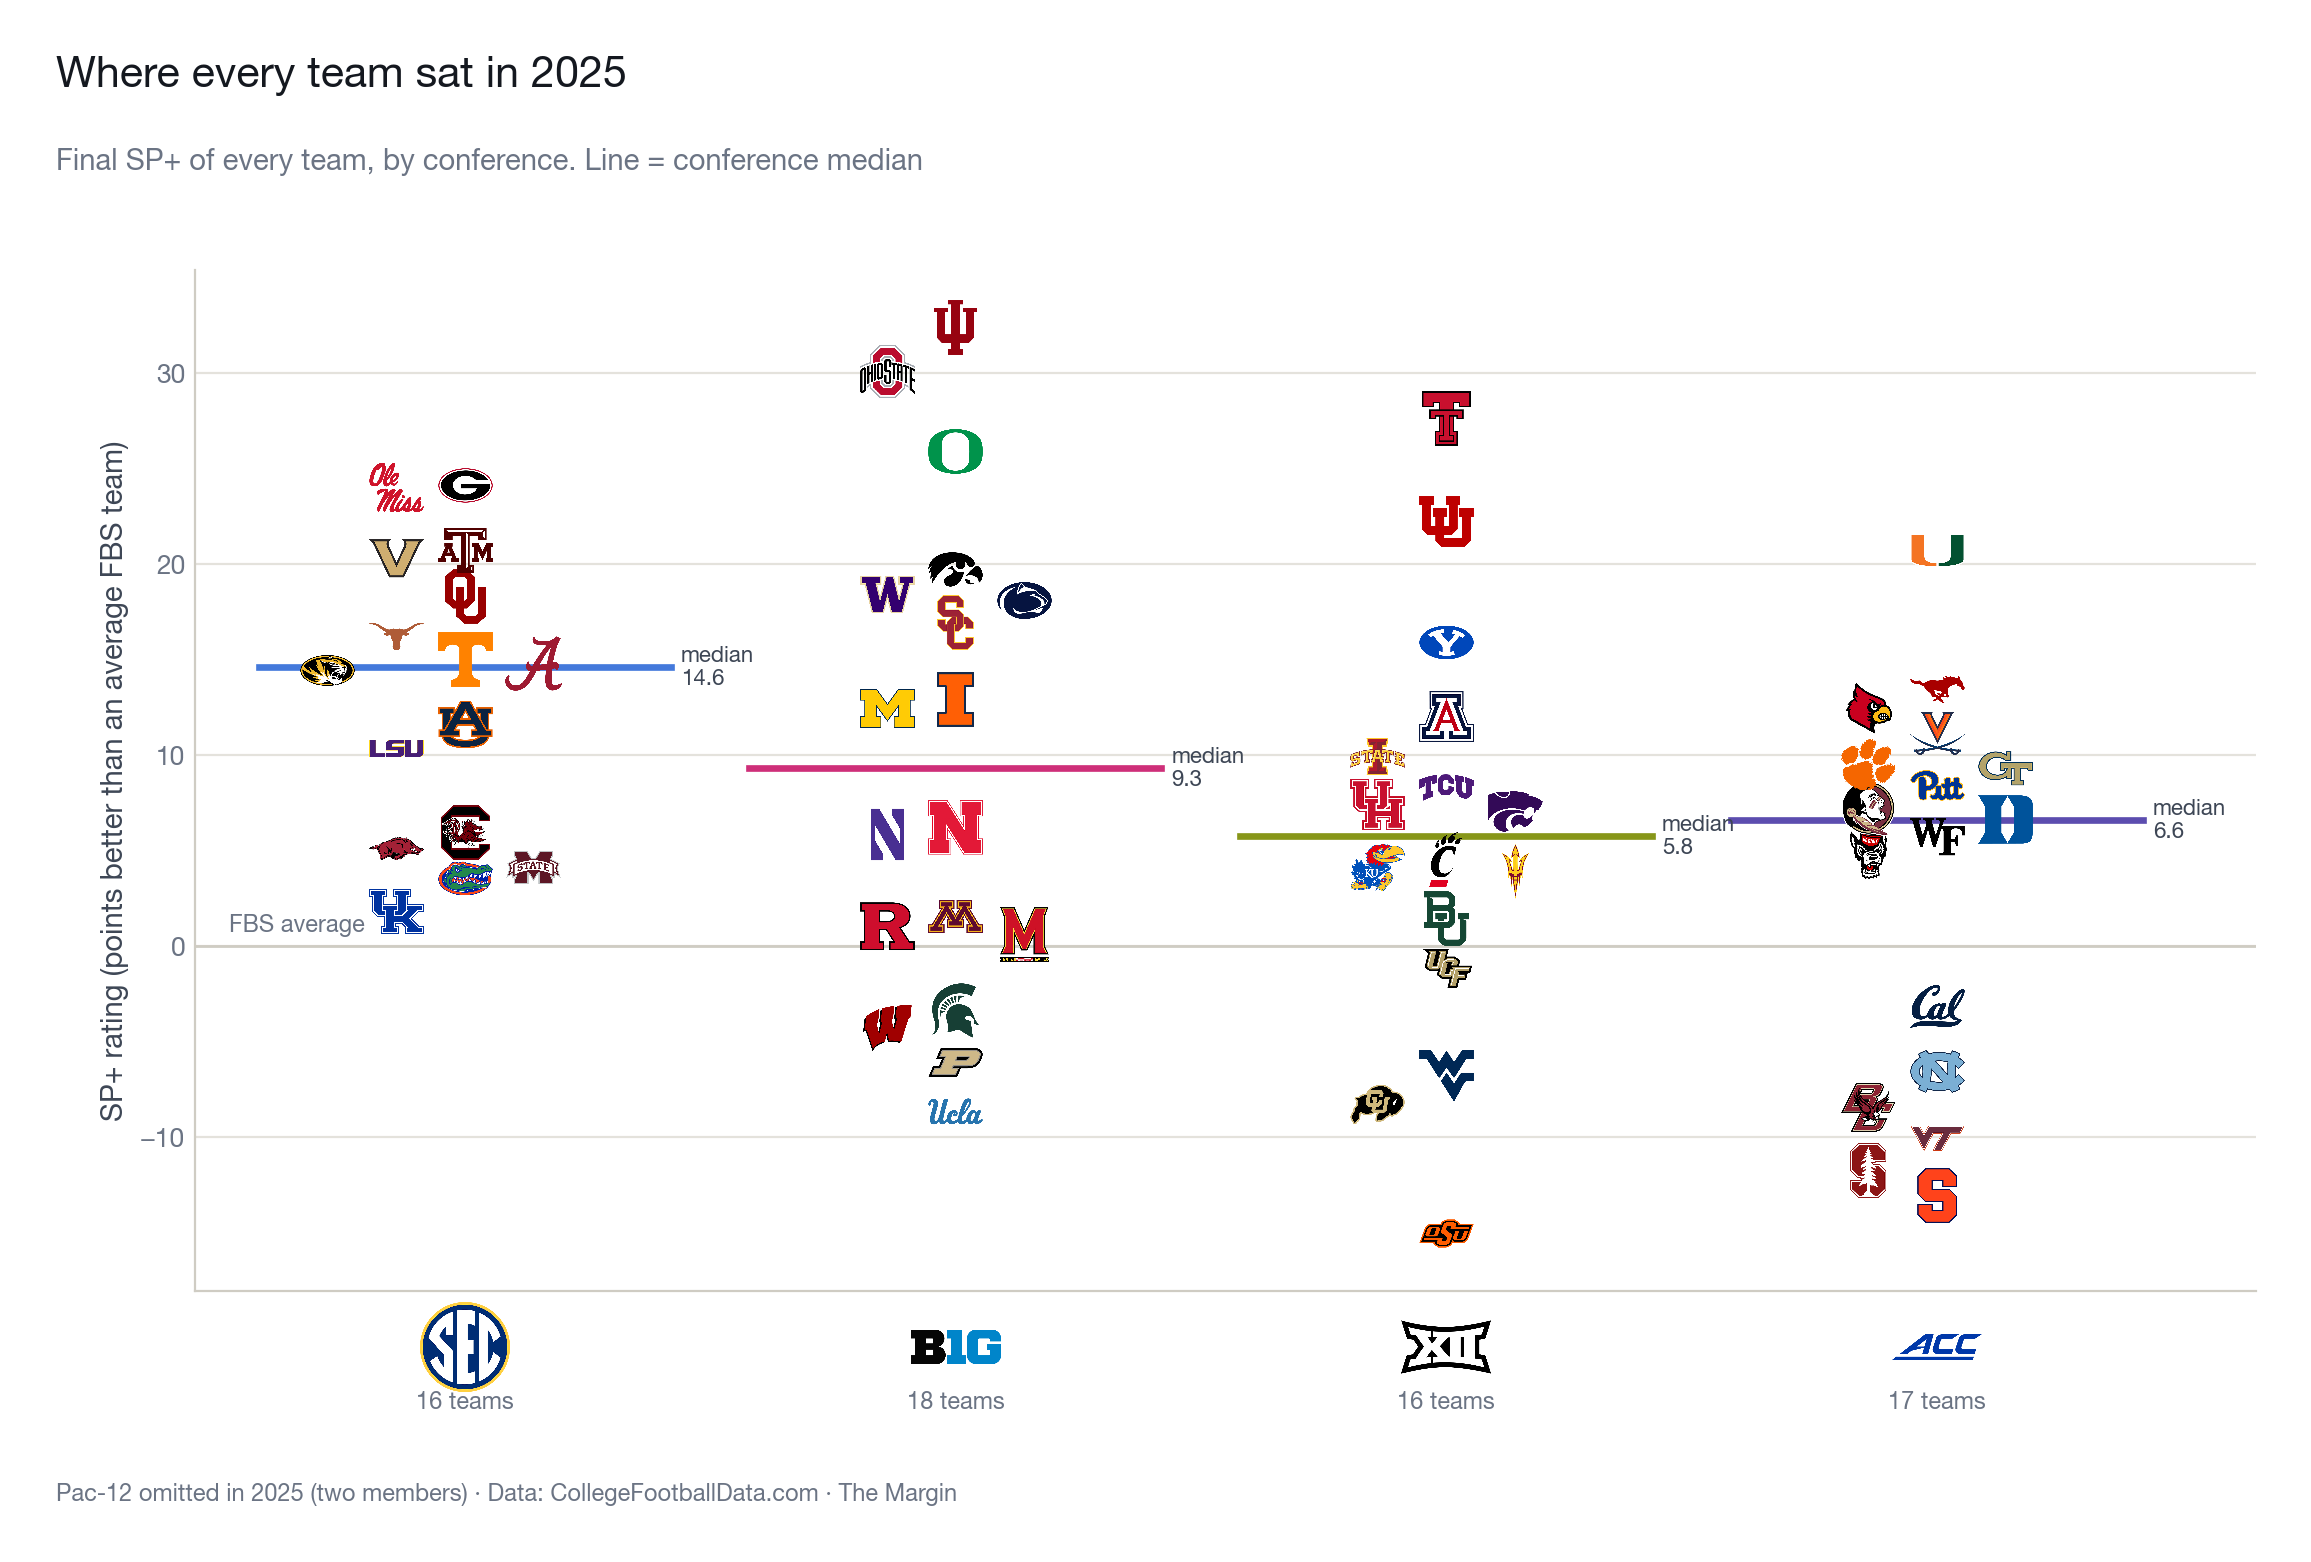
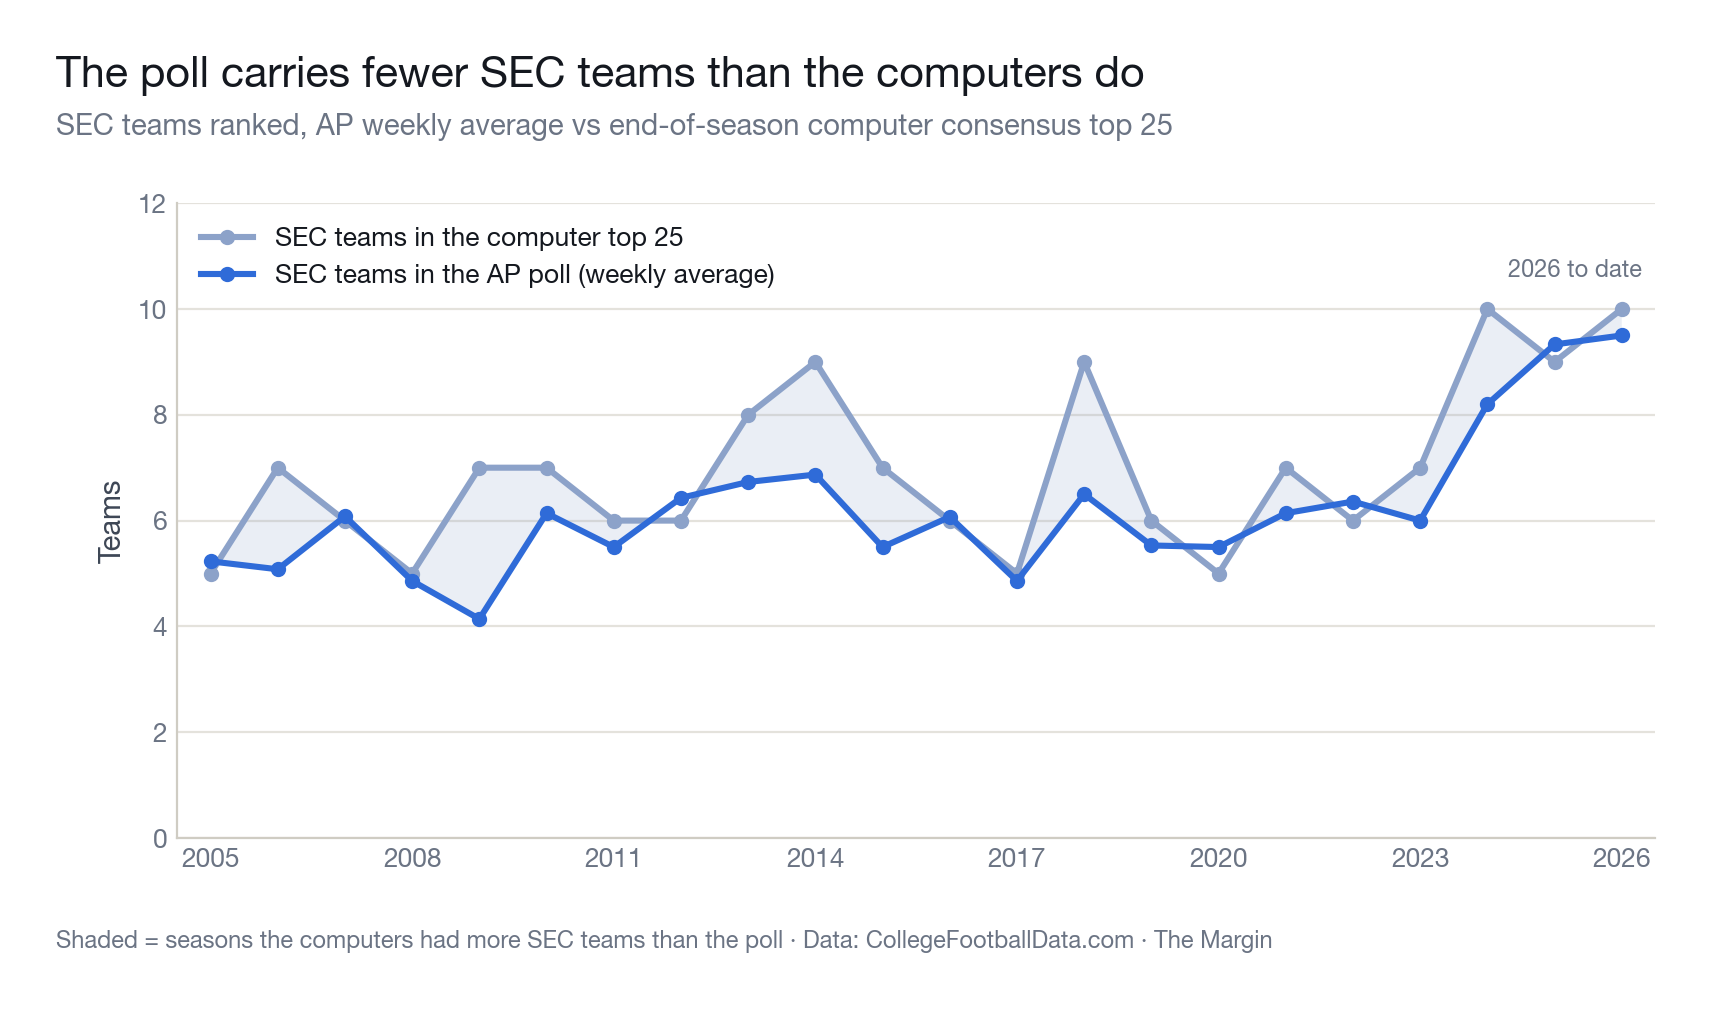
That depth is exactly why the poll always looks so crowded with SEC teams, and if anything the poll undersells it. In 14 of the last 21 seasons, the AP carried fewer SEC teams in a typical week than the computers had in their final top 25. In 2024, voters ranked an average of 8.2 SEC teams a week; the computers ended the year with 10.
Inflated Numbers?
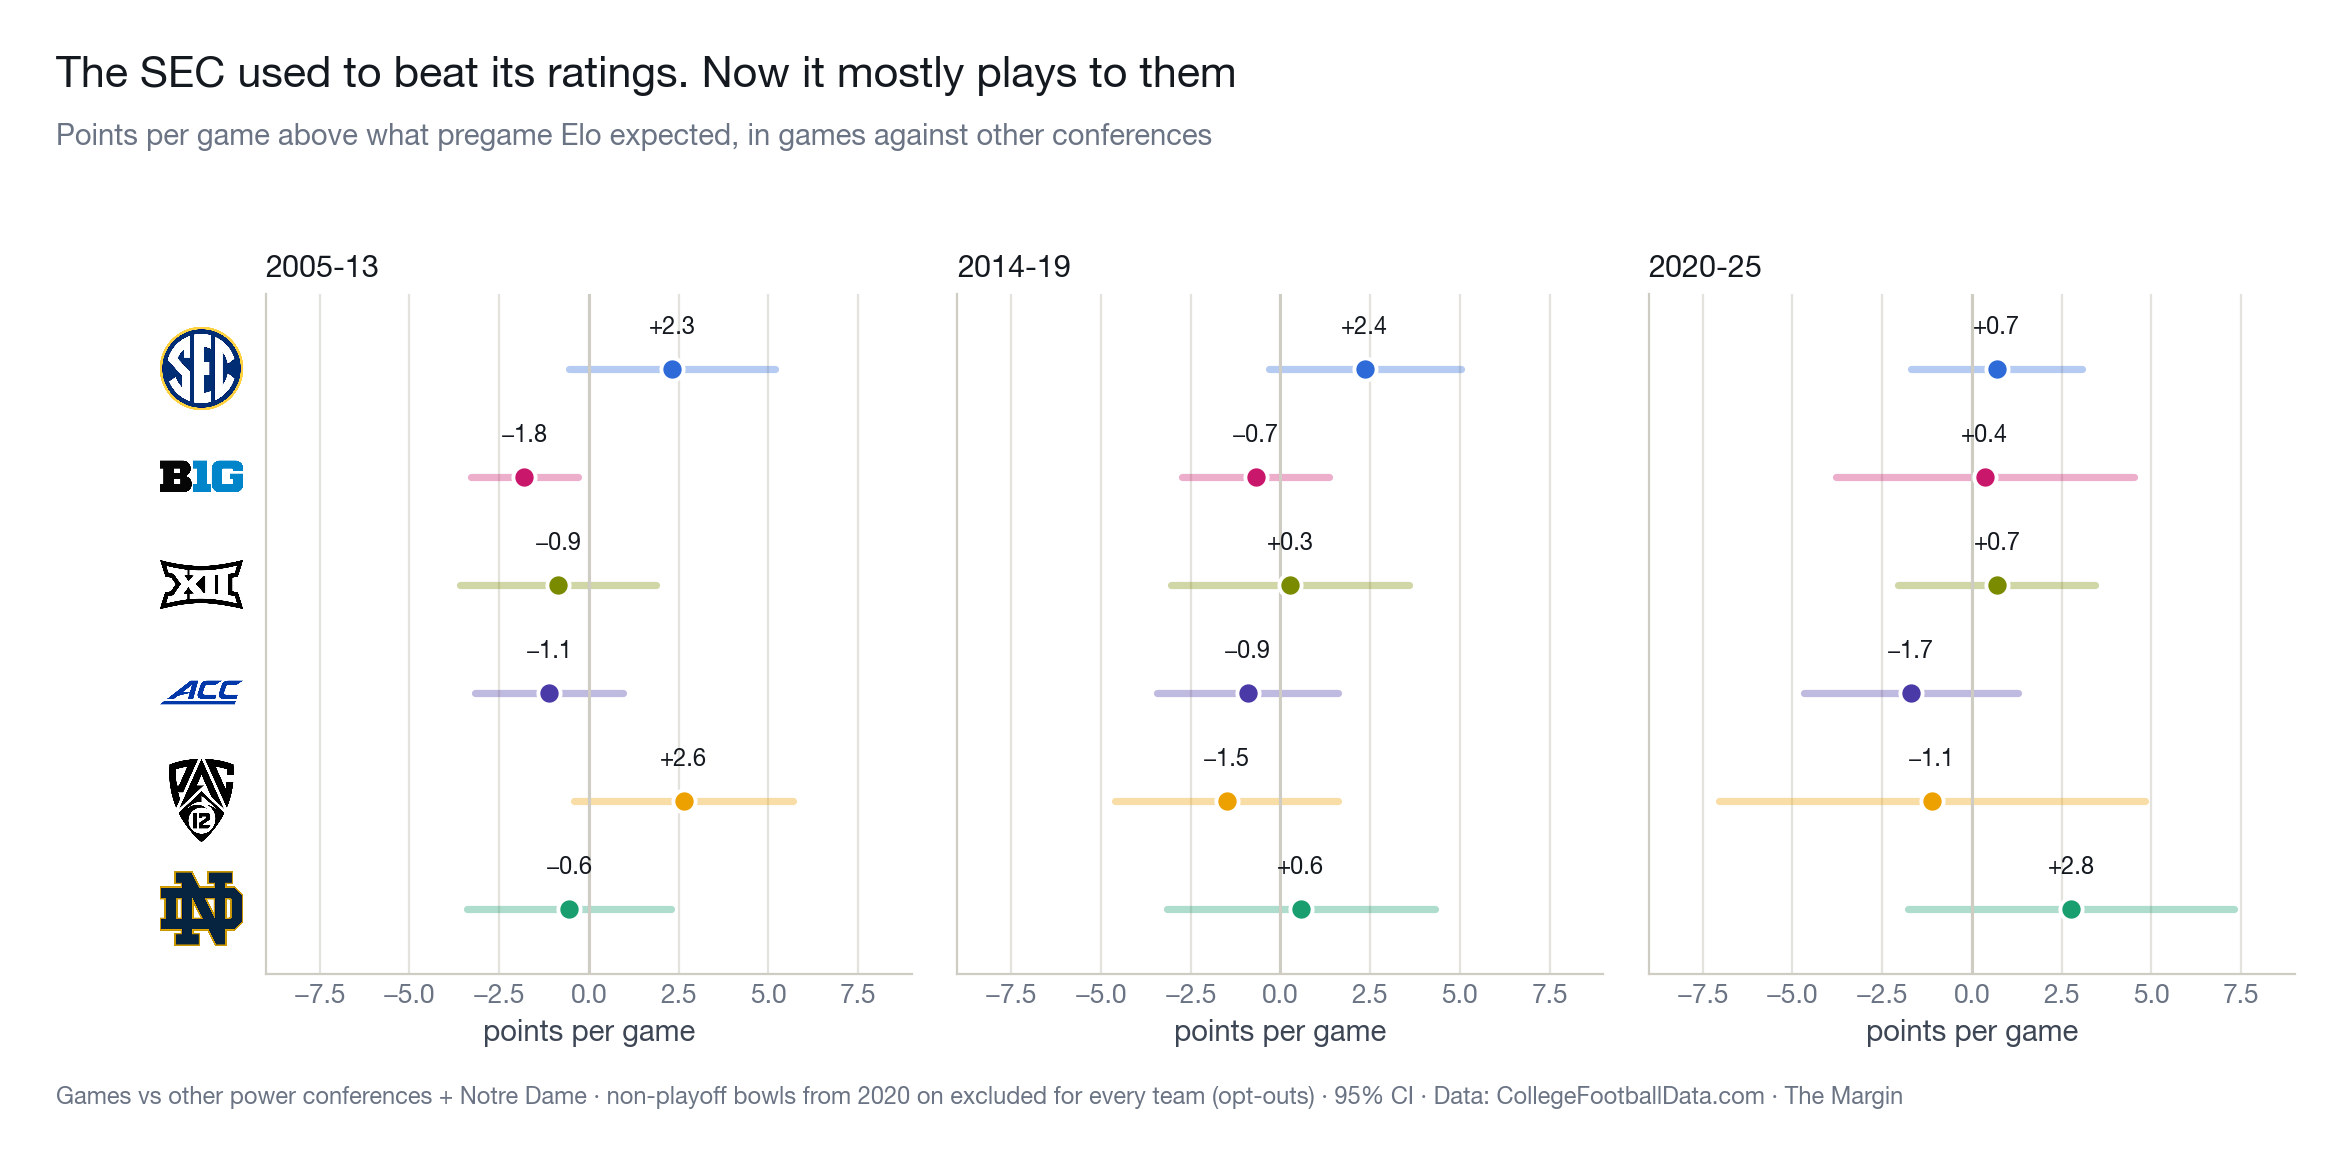
Now, you might be thinking the SEC's numbers are bloated by internal inflation when teams play each other. We found that is not the case. When SEC teams leave the conference, they perform almost exactly as their own SP+ ratings predict, which is what you would expect if those ratings are real rather than inflated.13 Beyond that, the SEC consistently performs in the upper echelon of conferences in points per game above what Elo expects against non-conference power programs, Notre Dame notwithstanding (fans are begging you to get a real schedule). The SEC boasts the best record of any conference against non-conference power programs at 166–123, and prior to this era of bowl opt-outs, they were 80–50 (+4.1 points over Elo) against power programs in the postseason.14 As the NIL and portal era has taken over, we have seen the SEC's edge against non-conference power programs shrink to about what the ratings expect.
Where's the Hardware?
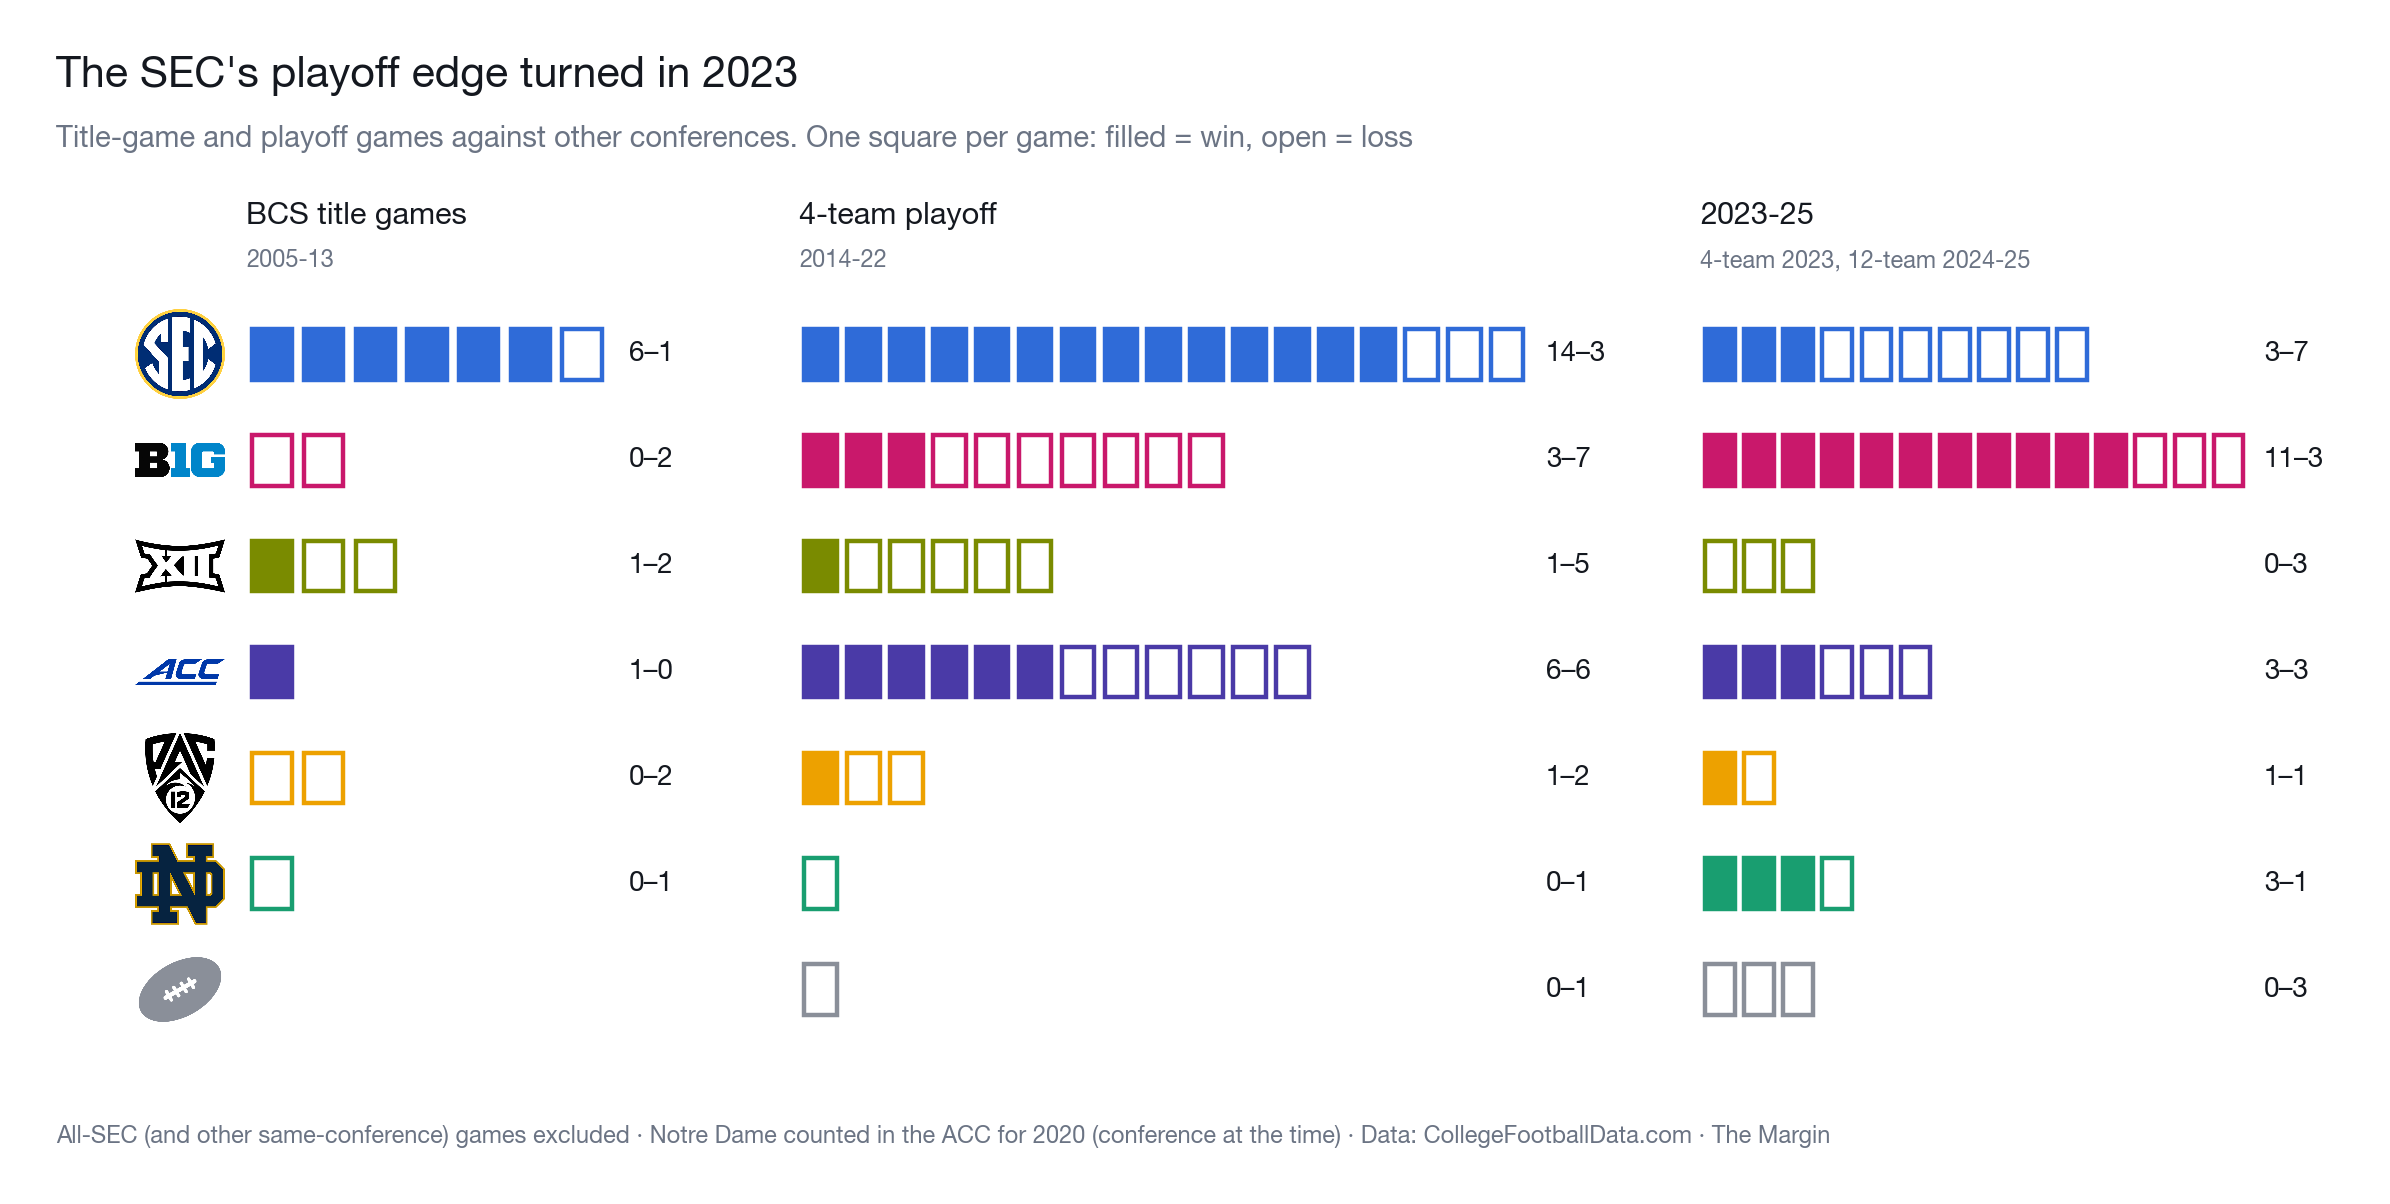
Even with all these top-end performances, this is where the critics of the SEC really get to stake their claim. The top of the SEC is not what it used to be. From 2005-2022, the SEC dominated championship/playoff play with a record of 20–4 versus non conference opponents. They were one of two conferences over .500 as the ACC finished that period 7–6. Since 2023, the SEC has struggled on the biggest stage, going 3–7 while the Big Ten has led the charge going 11–3. Now records are not the end all be all as we play many more playoff games today than we did in 2007, but this falloff from the SEC cannot go unnoticed.
The Verdict
So is the SEC overrated? Do they get propped up? Is there bias in the rankings? Honestly, not really. They do receive a slight week-to-week bump compared to other conferences but this typically washes out with the SEC overperforming those rankings and having more teams finish in the top 25 in the computers than in voting polls. Additionally, the SEC is not given a cushion by playing each other: every conference's losses cost about the same once you account for who they lost to. Within the SEC, these ratings are earned, not given. Computers show 88% of poll rated teams deserved to be there and only 4% of their losses come to poll and not computer rated teams. And this iron sharpens iron mentality isn't conference contained. The SEC routinely performs over expectation against non-conference power programs, though that edge is fading as seen in the lack of national championships. If anyone is getting a break from the poll, it's the ACC, whose ranked teams have finished well below their slots since 2020, while the Big Ten appears to have been the one short-changed. Still, the SEC gauntlet is very, very real. Top to bottom, this conference is a grind and incredibly tough to conquer. Some might even argue that winning the SEC is the hardest thing to do in the sport.
Footnotes
-
Data. CollegeFootballData.com: the 2005-2025 seasons plus 2026 through Week 5. Every AP poll; SP+, FPI, SRS and Elo ratings; the NFL draft; 247Sports recruiting; every FBS game. Conferences are as they were at the time (the Pac-10 is grouped with the Pac-12, the Big East counts as a power conference through 2012, and Notre Dame is grouped with the ACC in 2020, the season it played an ACC schedule).
Method. Each comparison is an ordinary least squares (OLS) regression: it estimates how a poll outcome (preseason rank, spots dropped after a loss, in-season rank) moves with each factor while holding the others fixed, which is what lets us compare SEC teams with otherwise-equal teams instead of just comparing averages. Standard errors are clustered by team, so a program that shows up in many seasons isn't counted as many independent data points. A result is called statistically significant when its t-statistic is at least 1.96 in either direction (95% confidence).
"An equal team." A team with the same values on everything that comparison controls for, listed in that section's footnote (for example, the same Elo rating and record for in-season rank, or the same pre-loss rank, margin, opponent quality, venue and week for losses). SEC teams are always compared with the average equal team from the other power programs: the Big Ten, Big 12, ACC, Pac-12, Big East (through 2012) and Notre Dame, weighted by games played. No single conference is the baseline.
"The computers." The average of four ratings: SP+ (Bill Connelly's efficiency-based rating), FPI (ESPN's Football Power Index), SRS (the Simple Rating System, built on margin of victory and schedule) and Elo (a results-only rating updated after every game). Each is put on a common scale within the season and averaged; the "computer top 25" is the top 25 of that average at the end of the season. That is deliberately hindsight, since the question is whether a team turned out to be good. Where hindsight would be unfair, we use that week's Elo instead, which only knows the games already played. ↩
-
Preseason AP rank, SEC vs. an equivalent team from the other power programs, as each explanation is added (teams ranked preseason or top 40 in last season's computer power, 2005-2025, n = 816): conference only, 2.1 spots higher (t = −1.1, not significant); + last season's results, 0.1 lower (t = 0.1); + NFL draft talent on the roster, 0.7 lower (t = 1.0); + four-year recruiting, 2.2 lower (t = 3.9); + brand, 1.7 lower (t = 3.3). Draft talent is measured after the season (players later drafted from that roster), so it is a roster-quality proxy rather than something voters saw in August; recruiting and brand are known in August. ↩
-
Holding the preseason slot and four-year recruiting fixed, brand's effect on a team's end-of-season computer rank is −0.7% per 50 points of brand score (t = −0.15), statistically indistinguishable from zero. Recruiting, by contrast, is significant: each standard deviation finishes 22% better than its preseason slot (t = −3.2). Brand score = the sum of (26 − final AP rank) over the previous 10 seasons. ↩
-
Extra spots dropped after a loss vs. the other power programs: SEC +0.02 (t = 0.1), Big Ten +0.04 (t = 0.2), ACC +0.11 (t = 0.7), Big 12 −0.08 (t = −0.6), Pac-12 −0.16 (t = −1.2), G5 +0.01 (t = 0.1). ↩
-
Notre Dame is a single program, so its estimates carry no meaningful statistical interval. ↩
-
Compared with other power programs, a ranked SEC team losing to a ranked opponent dropped 1.21 fewer spots in 2005-13 (t = −2.4) and 1.11 fewer in 2014-19 (t = −2.3), both significant. Losing to an unranked opponent cost it 0.56 (t = 1.1) and 0.81 (t = 1.7) more spots, neither significant. Net across 2005-2025: −0.05 spots per SEC loss. In 2020-25 both effects are gone (+0.12, t = 0.2; −0.02, t = 0.0). ↩
-
In-season AP rank vs. an equal-Elo, equal-record team from the other power programs: 2.4 spots higher in 2005-13 (t = 6.1), 0.6 in 2014-19 (t = 1.1, not significant), 1.9 in 2020-25 (t = 3.8); 1.8 spots across 2005-2025 (t = 5.4). ↩
-
2020-25, same comparison: ACC ranked 0.5 spots higher than its record (t = 0.8), Pac-12 0.8 higher (t = 0.9). Neither is significant. ↩
-
SEC teams finished 2.7 spots better than their in-season Elo rank implied across 2005-2025 (t = 3.7): 2.6 in 2005-13 (t = 3.7), 4.4 in 2014-19 (t = 3.6) and 1.5 in 2020-25 (t = 1.0, not significant). Finish = end-of-season average of SP+, FPI and SRS. ↩
-
AP-ranked teams, 2020-25: end-of-season computer rank vs. the AP slot they held, relative to the other power programs. ACC 34% worse (t = 3.9), or 3.7 poll spots (t = 2.6). Big Ten 22% better (t = −2.3), or 2.3 spots (t = −1.9, just short of significance in spots). Pac-12 26% worse (t = 2.4), but only 1.8 spots (t = 1.2, not significant), so it doesn't hold up across both measures. SEC 2% better (t = −0.2); Big 12 7% worse (t = 0.7). ↩
-
The ranked label on its own, holding the opponent's actual (end-of-season computer) quality fixed, across all conferences, 2005-2025: 1.48 fewer spots dropped after a loss (t = −8.6) and 1.56 more spots gained after a win (t = −13.6). Losing to an unranked team the computers rated top 25 earned 0.26 spots (t = −1.1, not significant). Share of ranked teams' wins that came over ranked opponents: SEC 26.7%, the highest (Pac-12 22.8%, Notre Dame 22.0%, Big 12 19.6%, Big Ten 18.2%, ACC 17.3%). Share of their losses that came against ranked opponents: SEC 69% (Notre Dame 71%, Big Ten 62%, Big 12 53%, Pac-12 52%, ACC 44%). ↩
-
"Unearned" credit uses the ranked-label effect (1.48 spots on a loss, 1.56 on a win, holding opponent quality fixed) applied only to opponents ranked by the AP but outside the end-of-season computer top 25. The SEC's total label credit from wins is 2.27 spots per ranked team-season, of which 0.60 is unearned. Notre Dame's unearned win credit is 1.28 (one program). ↩
-
Points per game vs. each team's own end-of-season SP+ in games against other power programs: SEC +0.5 in 2005-13 (t = 0.3), +0.2 in 2014-19 (t = 0.2), −1.5 in 2020-25 (t = −1.2). None is significant. ↩
-
Pre-2020 bowls vs. power programs: +4.1 points per game over Elo's expectation (t = 3.0). Because CFBD has no opt-out data, non-playoff bowls from 2020 on are excluded as evidence for every team; playoff games are kept. ↩