Big Third Down, Have to Have It
Quincy Smith · August 21, 2026
It's third and seven on their own eight yard line midway through the third quarter. The score is 10-6, neither offense really has been able to pull away, and it's looking like the defense is going to get back out there after just forcing a three and out. Over the voices of screaming Sooner fans, I turn to one of my best friends and say the words we know all too well.
"Big third down here, have to have it."
Turning back to the game, half the stadium holds its breath as the ball is snapped. Fans screaming as edge rushers close in. Strike down the sideline, first down Texas Longhorns. Sighs of relief, and defeat, roll throughout the stadium as Arch Manning keeps the drive alive.
In the heat of the moment, that play felt like the biggest play of the game. The Sooners had been suffocating the Texas offense, but they were able to carry some end of half momentum into an early touchdown. Now seemed like a chance to really separate and try to put the game away. Yet, as I think about that moment, I think about all the countless games I've watched and that feeling I get when some seemingly random down in the game feels like it is make or break. Why does it feel like third downs are so important? Why do some carry the weight of the world on them and others feel routine? Why do football fans everywhere get that compelling feeling that THIS is a big third down? These are exactly the questions that I set out to answer.
Methodology
So I set out to answer it by building a model1. This model was able to watch and track over 1.4 million snaps since 2014, remembering every single one and trying to find the invisible patterns between them. For every single down, the model set out to quantify two things: how did that play impact that team's chances of winning and how much did that play impact the expected points for the offense. Together, the model learns what plays define winning and what plays contribute most to putting points on the board.
One rule I held the model to: it never gets told which team or which coach is on the field.2 It only sees the situation in front of it - the down, the distance, the score, the clock - not who's calling or running the plays. That's on purpose. Tell it who's calling the plays, and it'll start baking each coach's habits into its own expectations. Tell it about the players on the field, and it'll start to incorporate their star power into its prediction.
The Down That Runs the Game
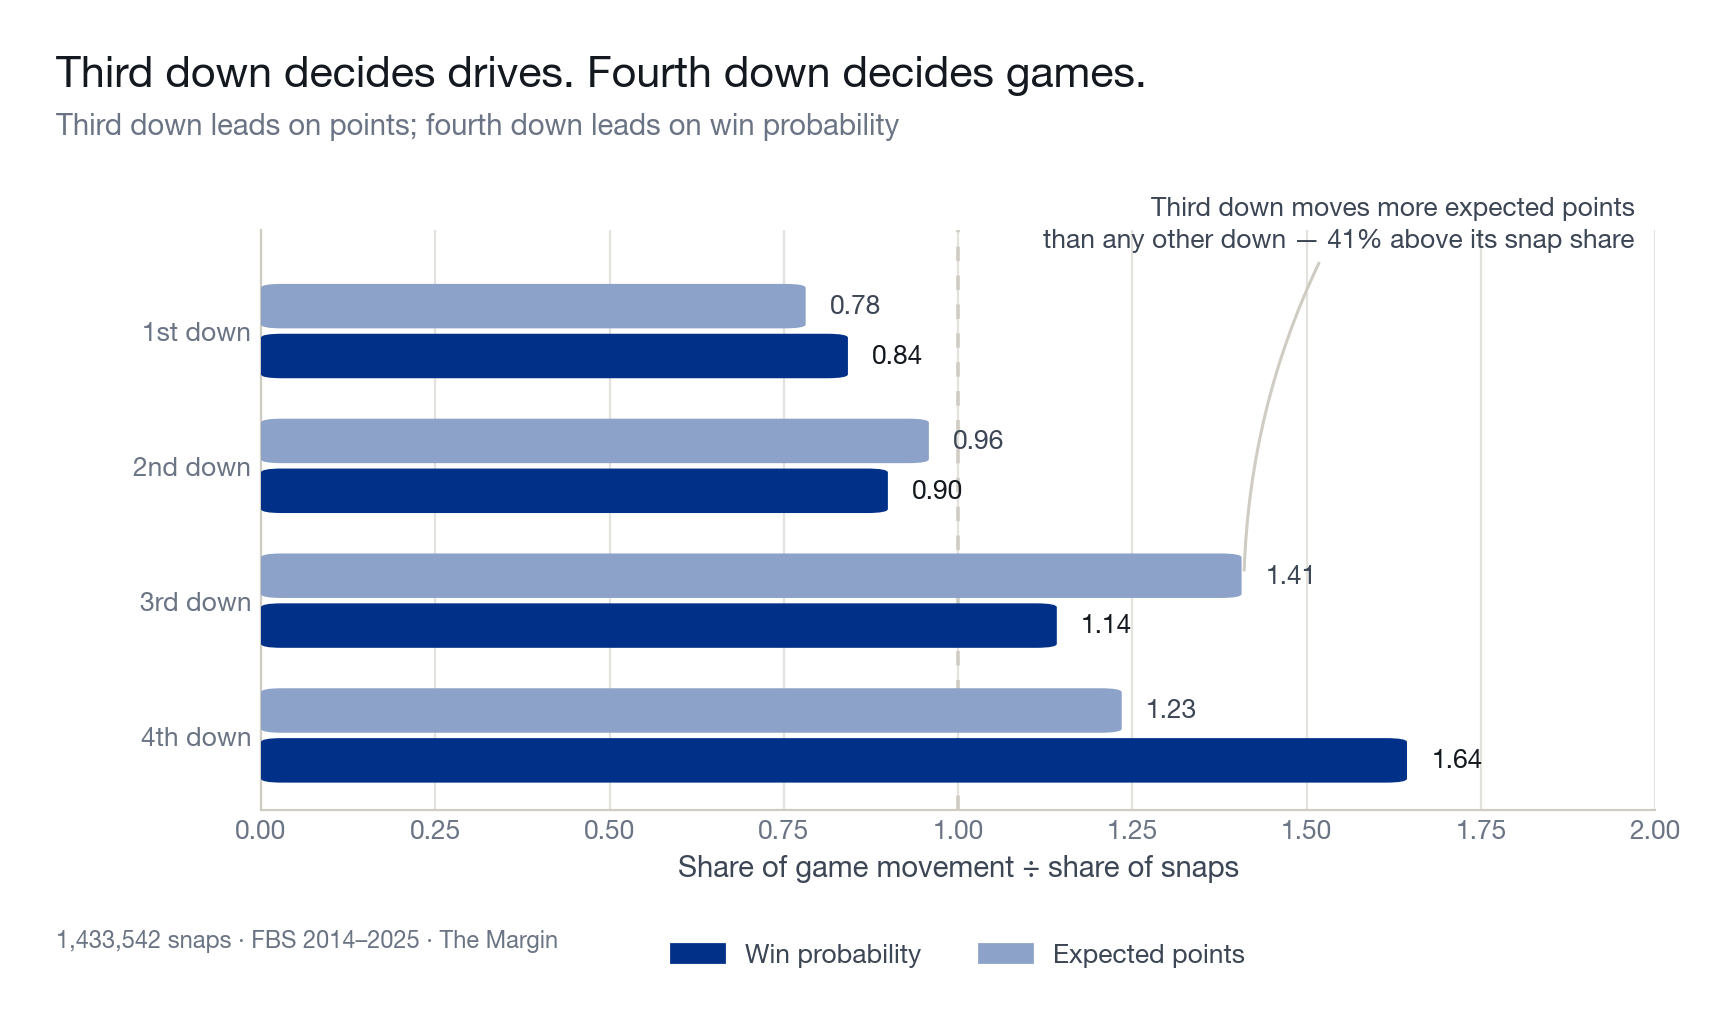
Big third downs aren't just a feeling, they are a mathematical reality. Third down is the most important down in football from an expected-points-movement perspective. Third downs represent 26.5% of expected-points movement despite only being 18.8% of downs, overrepresenting itself at 1.4x — more than any other down. While only 60% of touchdown drives face a third down at all, 9 out of 10 times when a scoring drive does get there, the offense converts it. On the flip side, nearly all punt drives face a third down, and only 16% convert one. Third down is the crux between giving the ball back or making noise on the scoreboard.
From a win-probability perspective, third downs are still massive, but fourth down is king. Third down captures 21.5% of win probability moved, around 1.1x its snap percentage. Comparatively, fourth down captures less overall win-probability movement (17.3%) but it's 1.6x its relative snap share. This is mainly attributed to clutch-time heroics and the late-game inability to punt the ball, causing massive win-probability swings. Still, third down is up there with the best of them when it comes to winning football games.
The Marquee Third Down
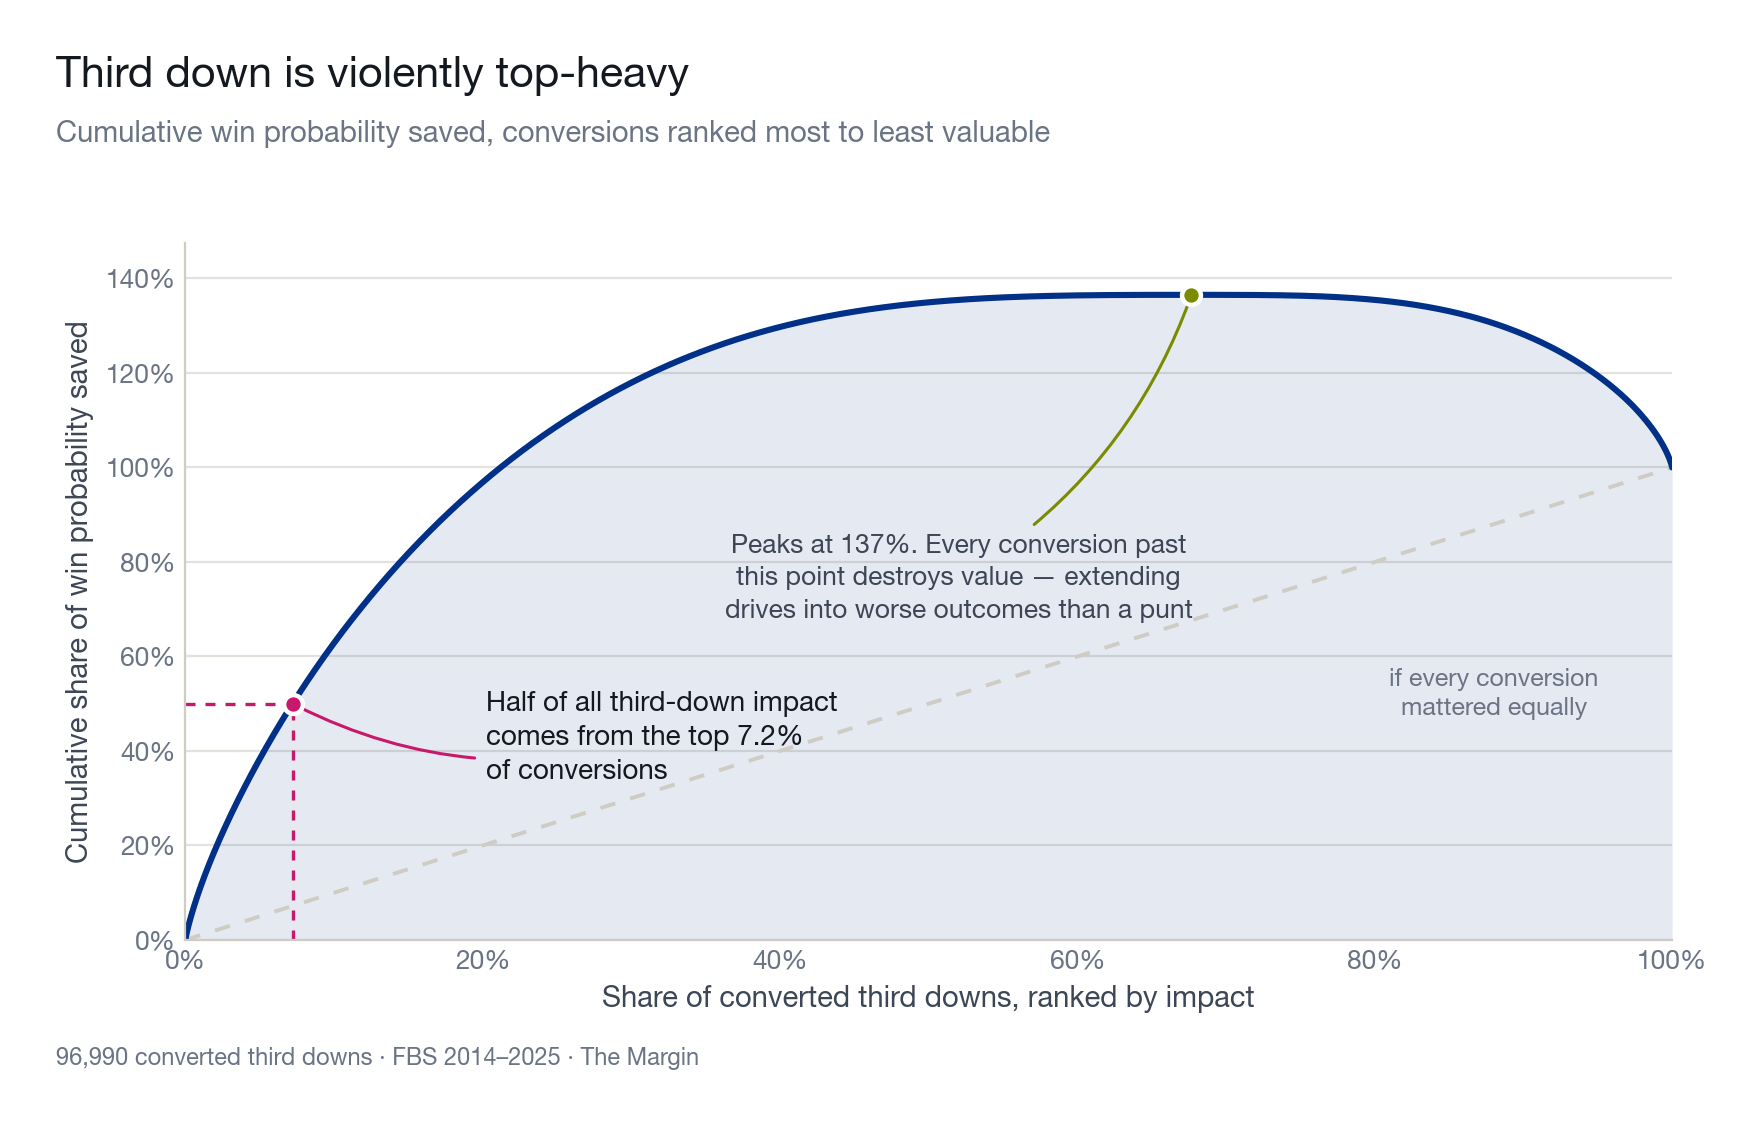
Not all third downs are created equal. When looking at the distribution of third-down conversions, the top 25% account for 108.8% of positive impact, while the bottom third of conversions result in a negative impact of 35%. This negative impact can be explained by drives that have third-down conversions but leave the team worse off than if they had just failed and kicked (like a pick six on the next down). In fact, nearly a third of all converted third downs (32.3%) individually finish worse off than if they'd simply failed. The conversion itself wasn't the problem, it's what happened on the drive afterward (like an ensuing interception or fumble). The single most important conversion is a third and long in the fourth quarter of a one-score game, worth 0.128 win probability. That is 3x the average conversion and nearly 20x a conversion in a blowout. One surprising finding is that third-down value actually decreases the closer you are to the marker. Defenses can cope with giving up a third and one, but convert a third and fifteen and it stays with them all night.
Where Seasons Are Made
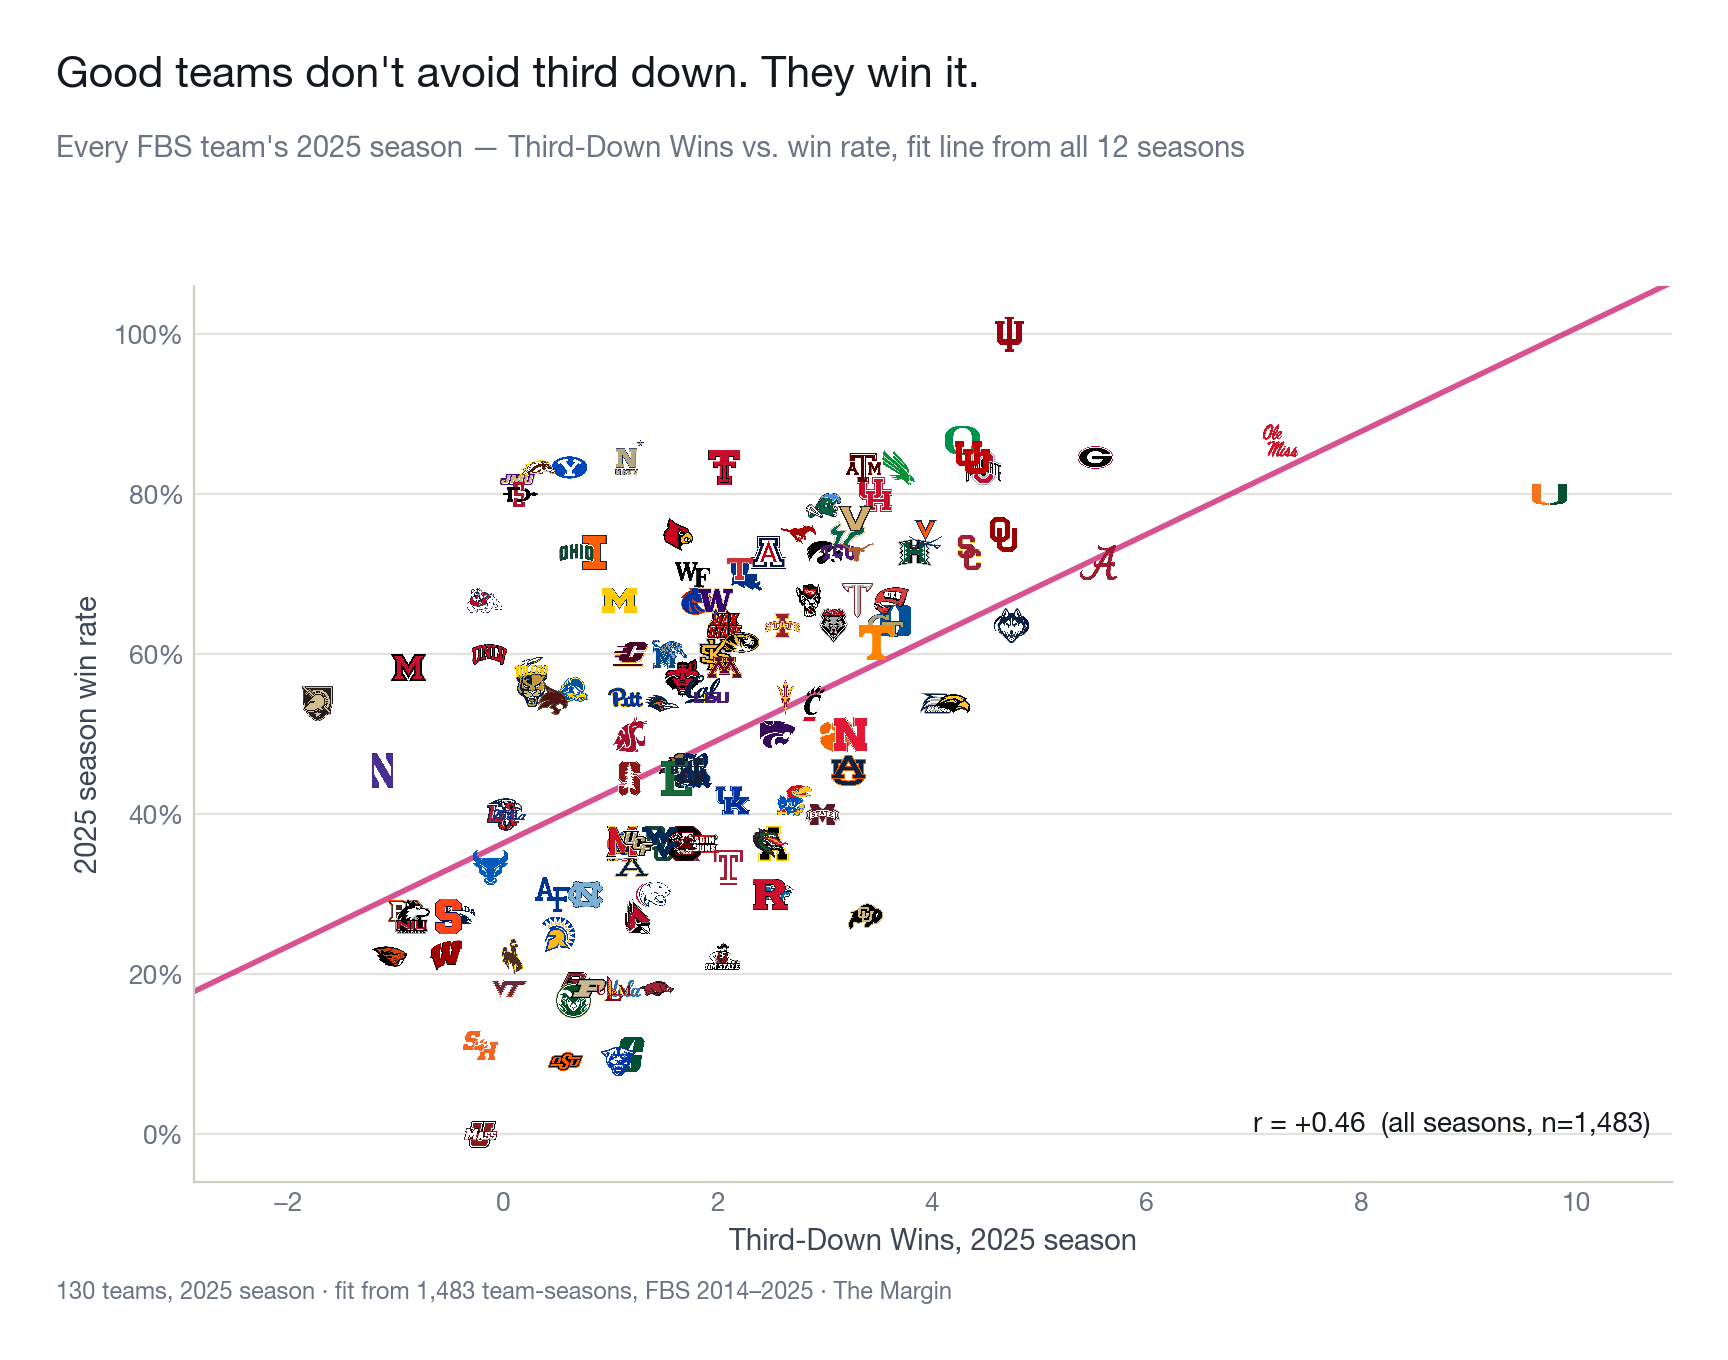
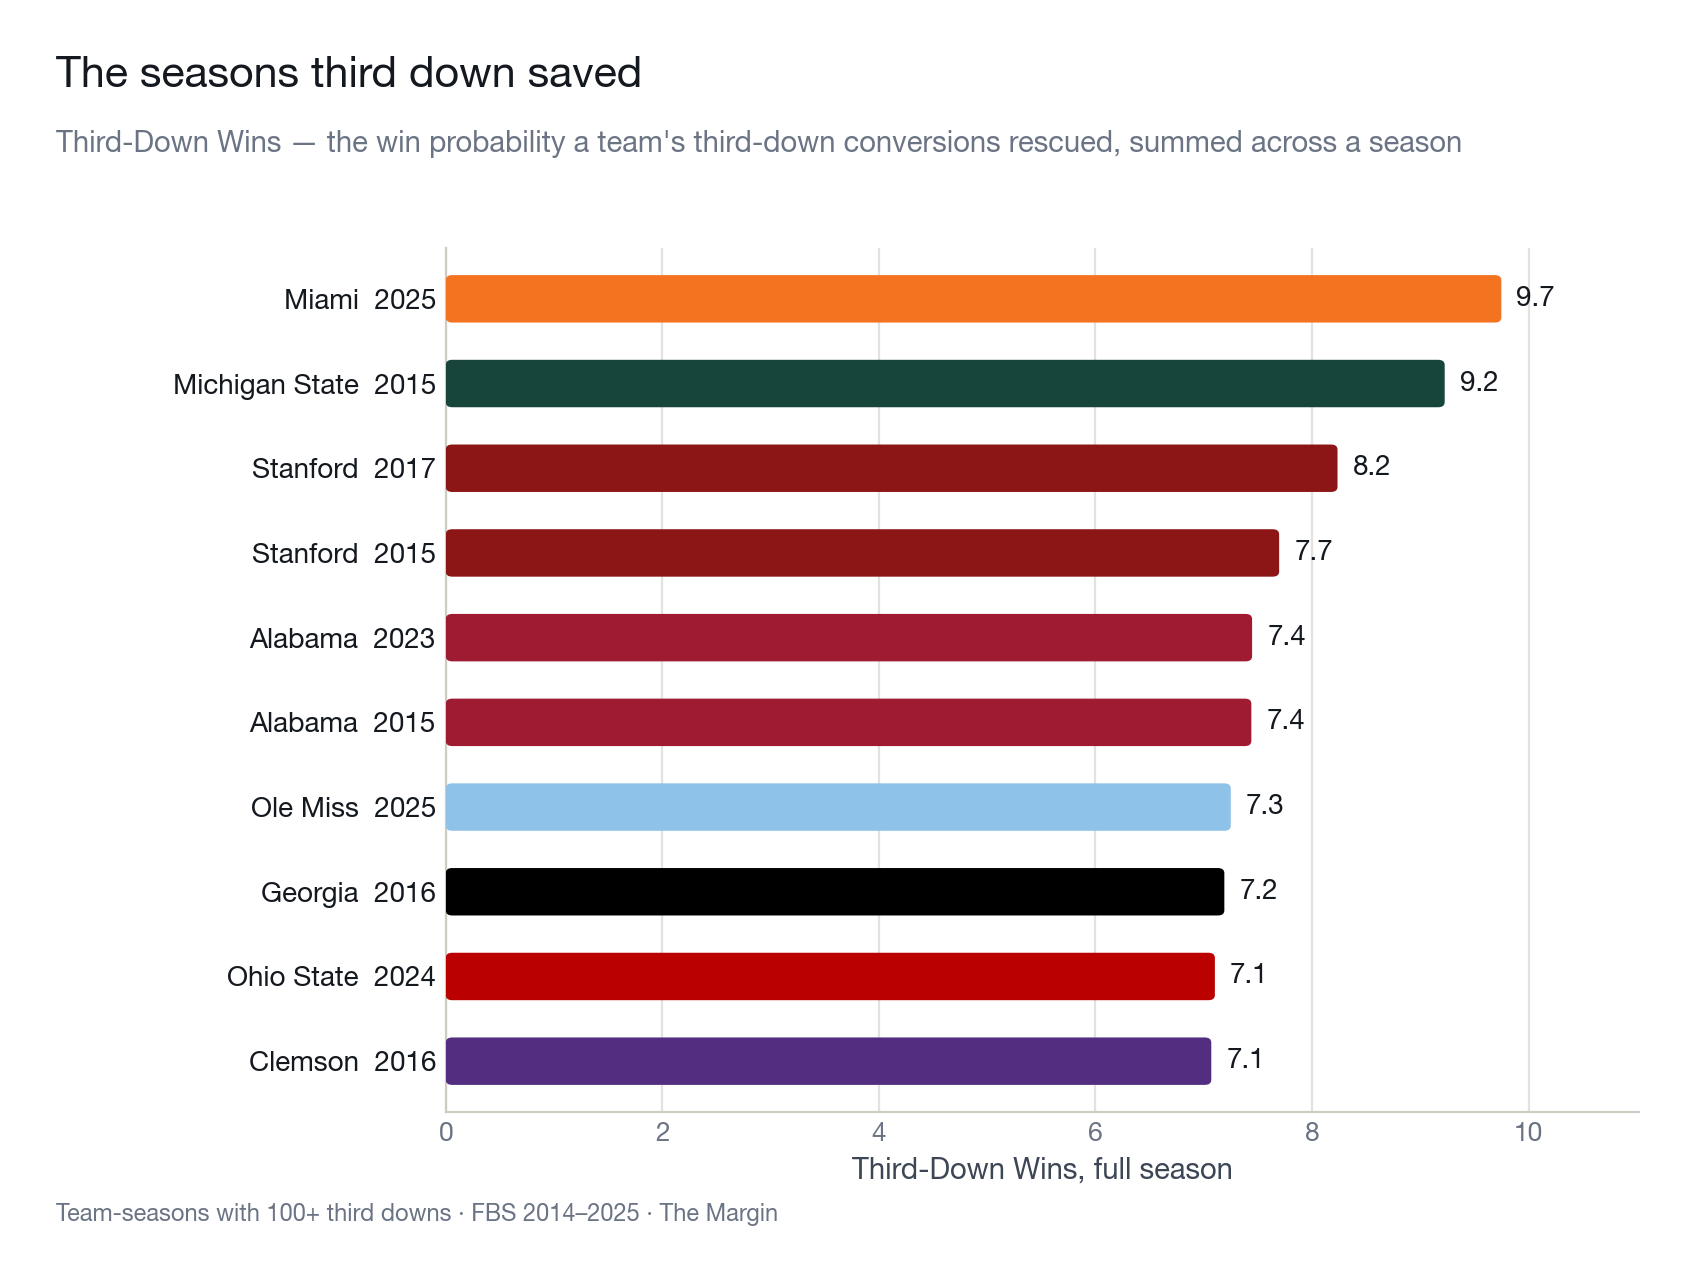
Unsurprisingly, converting third downs means winning football games (r = 0.57, all time). What is surprising is that facing fewer third downs doesn't. That correlation is just r = 0.13. The best teams meet third down head on and dominate. Third downs are where teams have their seasons made or lost. We saw this past year's Hurricane team go on a run to the national championship while leading the country with 9.7 Third-Down Wins3. Yet, third down success isn't the only metric for ultimate victory. Indiana won it all with just 4.7.
Still, third downs have helped teams create some pretty memorable runs. Sparty's historic 2015 season boasted the second highest in the data set as they were able to upset Ohio State and Michigan, win the Big 10, and make it the College Football Playoff. In Bryce Love's near-Heisman season, the Cardinal posted 8.2 Third-Down Wins, third-most all-time. Historically, being a great third-down team has created some of college football's most iconic teams, but that isn't enough as they often come up just short (2024 OSU notwithstanding).
X's, O's, and Jimmys and Joes
So now that we know third downs matter, don't we want to know which coaches handle them best? Is it their X's and O's, or their Jimmy's and Joe's, that's getting it done? Turns out, it's a little bit of both. A coach's third-down pass rate carries a near-moderate (0.36) correlation from stop to stop, showing that scheme really does travel with the coach. But third-down efficiency tells a different story in year one: it's slightly negatively correlated with the coach's own track record, before turning positive in year two and beyond. In year one, a coach is running his scheme with someone else's leftovers, players recruited for a different system. By year two, the roster has started to turn over toward players who actually fit what he's calling, and the scheme starts producing like it's supposed to. So coaches bring their system with them, but they still need their own guys to make it work. Coach identity alone accounts for nearly 6% of the variance in a team's third-down success rate. So to the fans out there with one of those elite third-down play callers, hold on and never let them go.
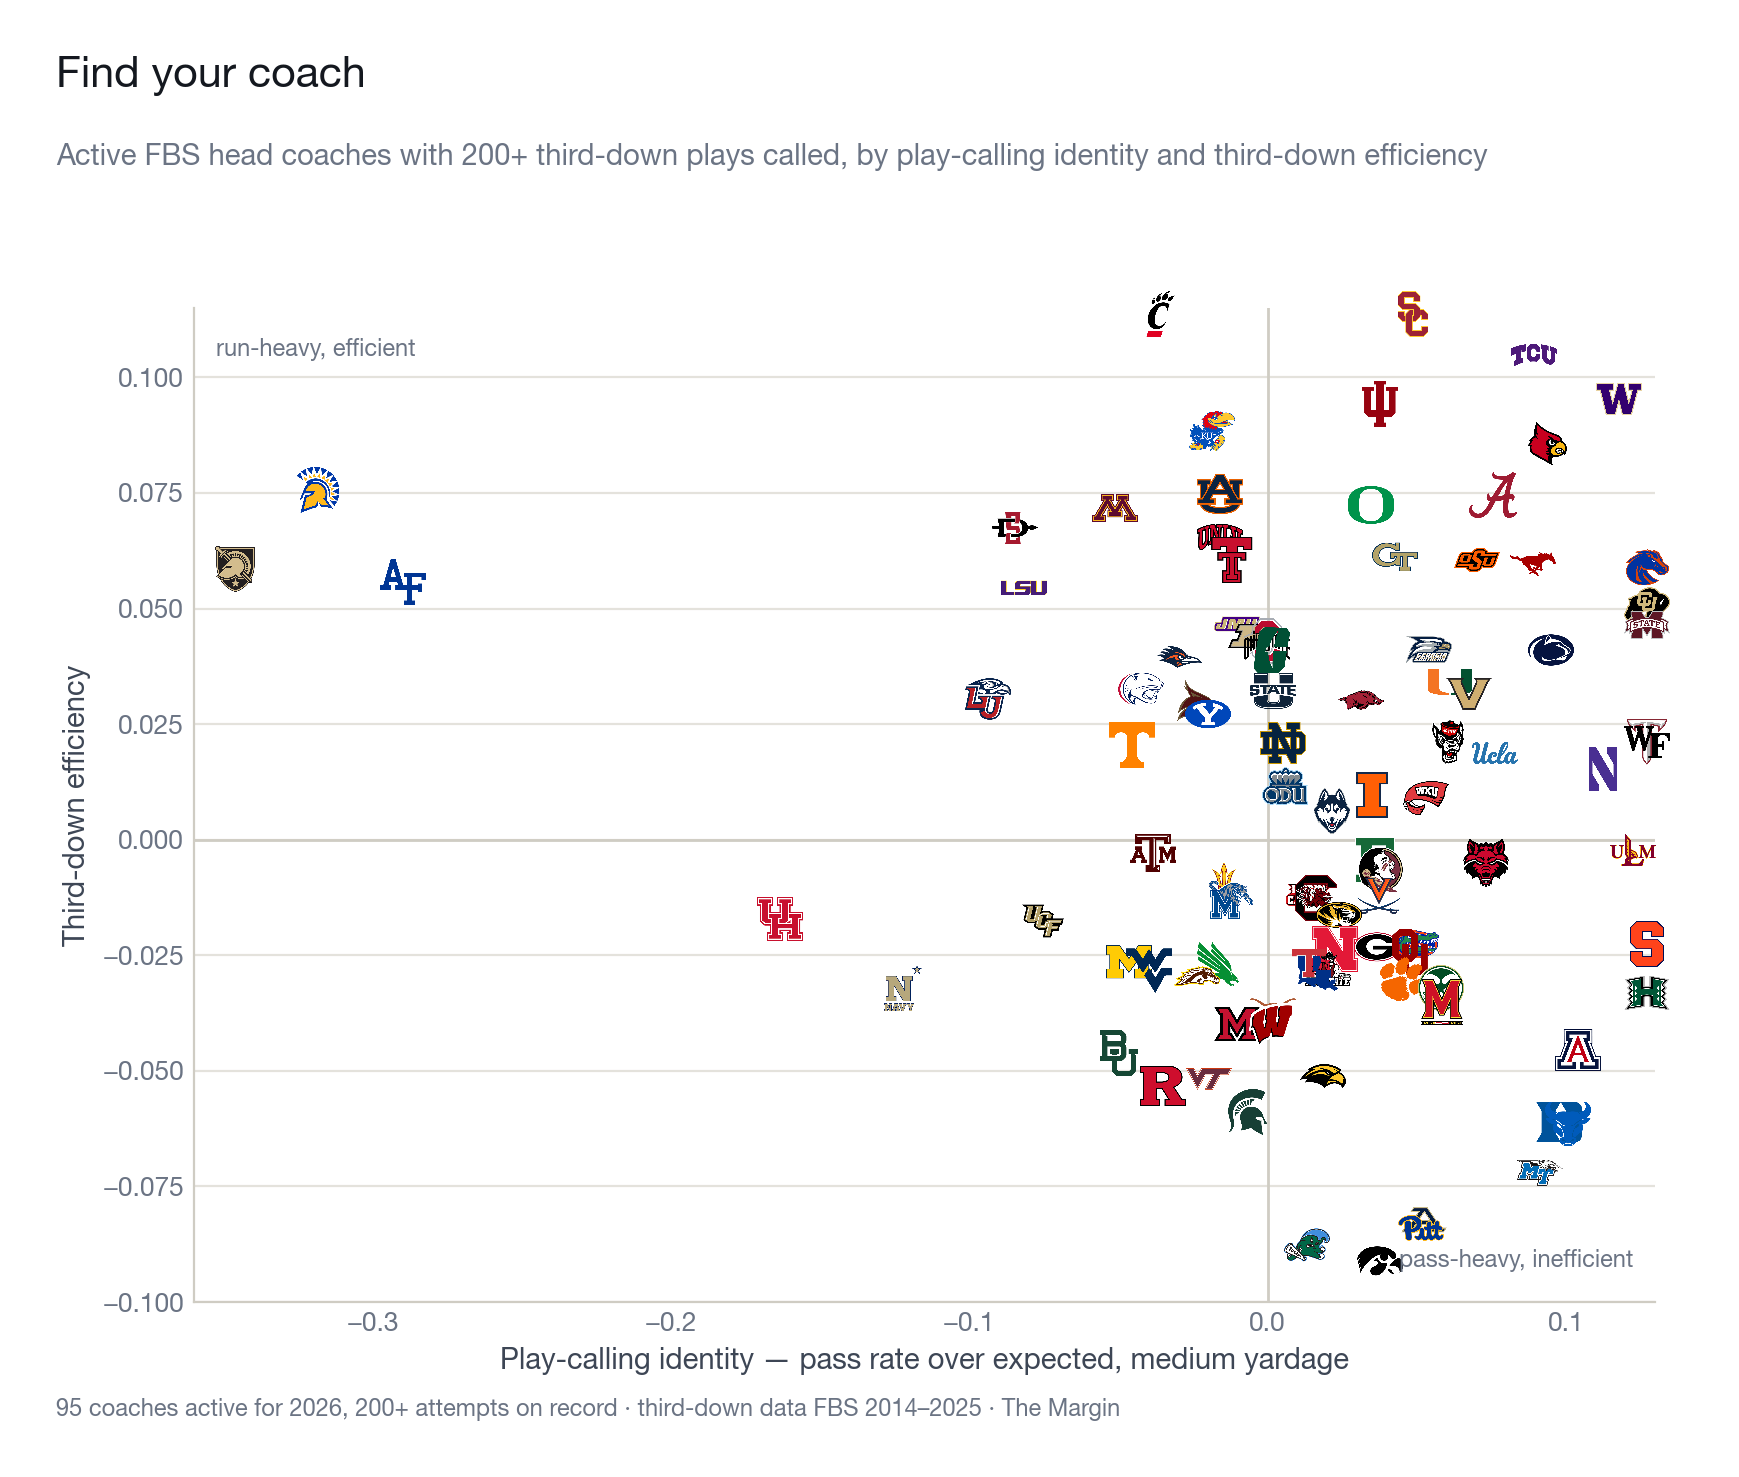
Not all third downs are big third downs, but the ones that are have massive impacts on a team's chances in this game and the season as a whole. A team's third-down identity comes from its coach, but he still needs his players to execute when it counts. Despite all of that, we didn't find a significant pre-snap "feeling" in the data. Nothing before the snap reliably predicts how big a third down will become. But that's the beauty of when sports meets analytics. Sometimes, despite the numbers, you just know. That feeling you get does truly have as big an effect as you thought it would. It's a provocative feeling, one that gets the people going.
Footnotes
-
A dual-head neural network — one head outputs win probability via a sigmoid, the other predicts the next scoring event as a 7-class distribution (touchdown, field goal, safety, turnover, etc., for both offense and defense), which converts to an expected-points value. 51,228 parameters, trained on 1,433,542 snaps of FBS play-by-play, 2014–2025. Trained on 2014–2023, validated on 2024 (Brier score: 0.128); 2025 is held out entirely, never trained or validated on, a true prospective test. ↩
-
31 numeric input features covering situational context (down, distance, field position, clock, score, timeouts), drive state (play count, elapsed time, previous play outcome), matchup strength (SP+ and talent differentials), and environment (weather, indoor/outdoor, game total), plus game period as an embedded categorical feature. No coach identity anywhere in the inputs, by design, keeps any real coaching effect out of the model's own expectations, so it can be measured afterward instead of learned away. ↩
-
Third-Down Wins (borrowing the spirit of baseball's WAR): the sum of win probability added by every converted third down across a season, measured against the counterfactual of that specific play failing. It's not literally a win total, but it's built to read like one. Summed to 1.0, it's worth about a single win. ↩